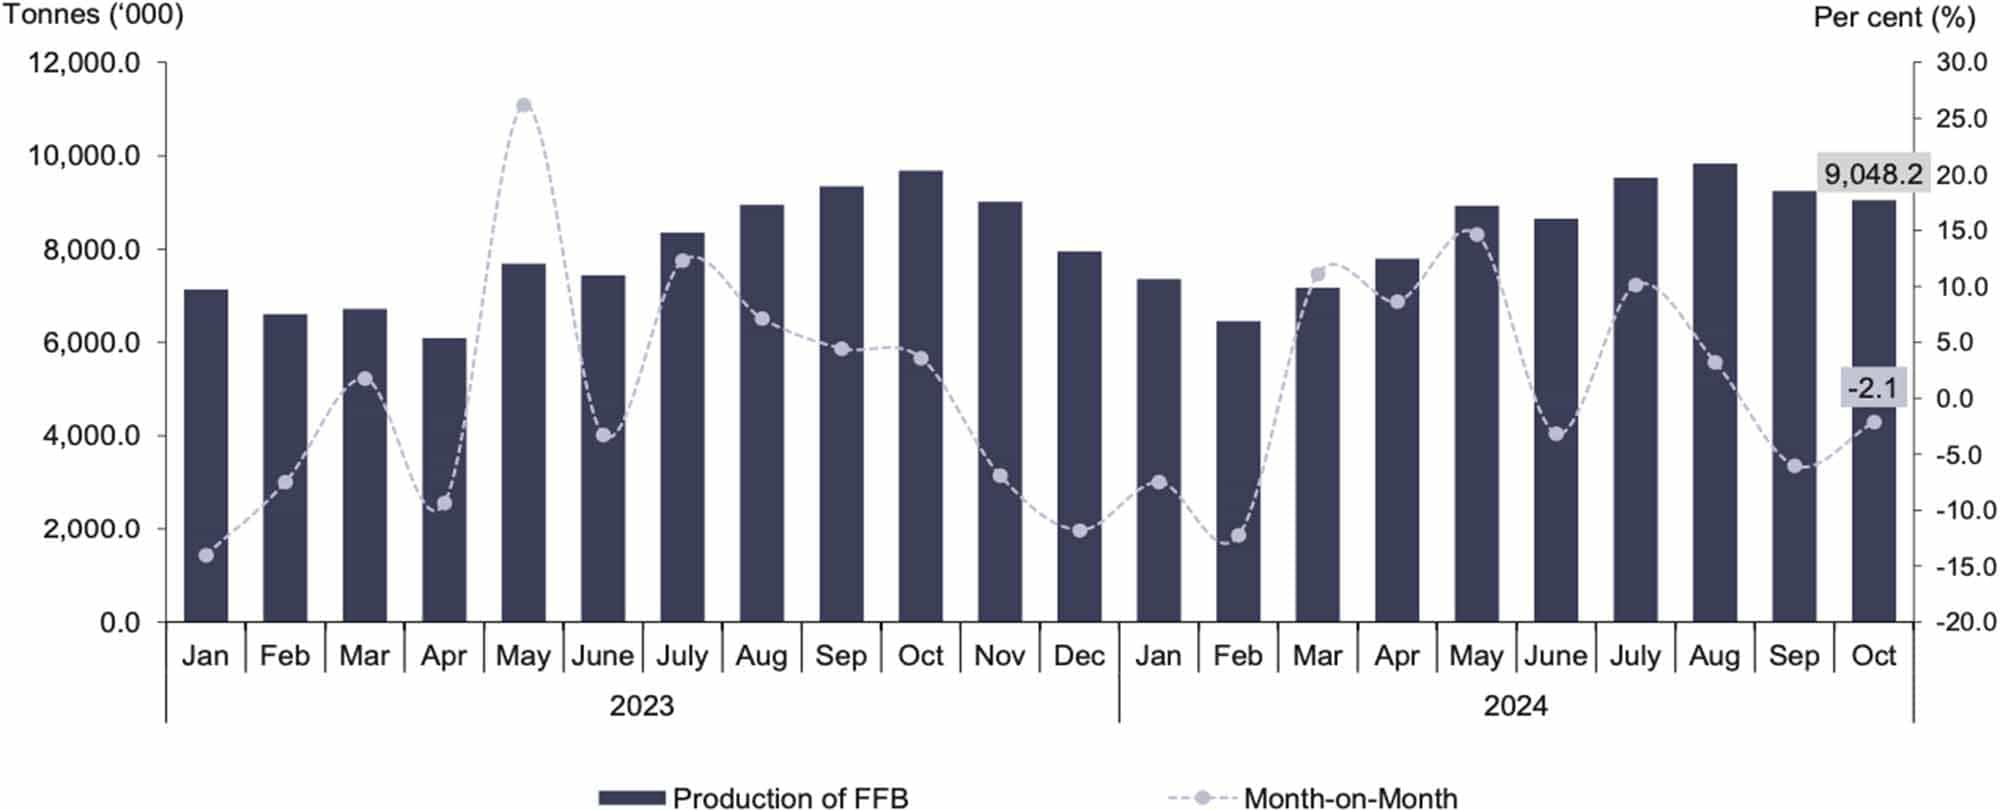
Fresh fruit bunches produced in October 2024 contracted by 2.1 per cent to 9,048,171 tonnes as compared to September 2024 (9,243,598 tonnes) (Chart 4). Following to this, the year-on-year comparison also declined by 6.5 per cent as compared to October 2023 (9,682,271 tonnes).
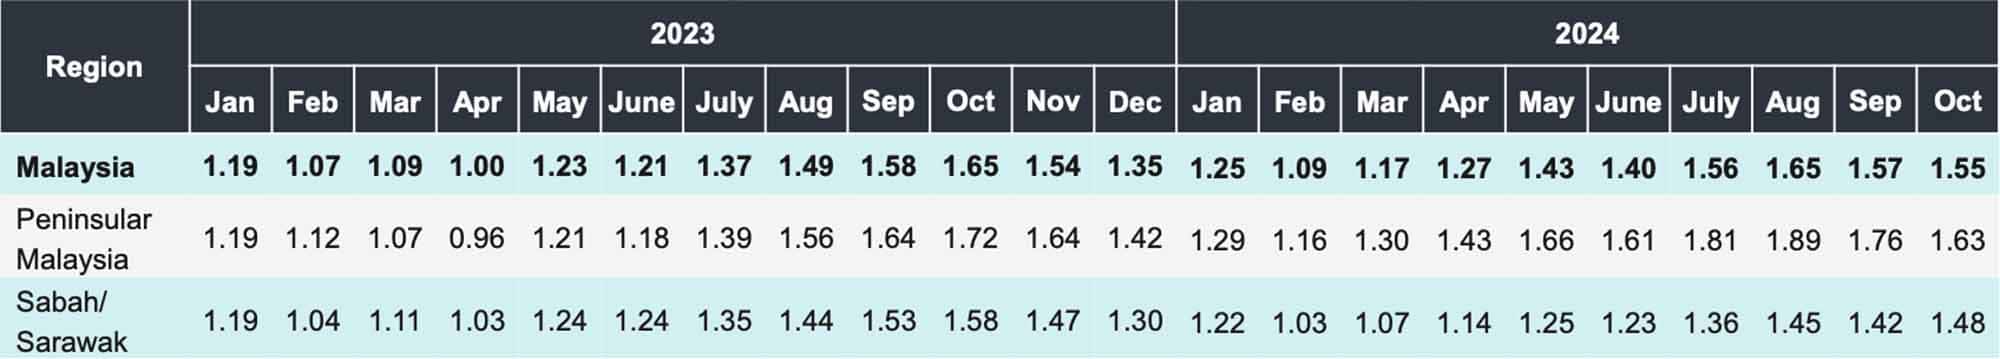
The average yield of fresh fruit bunches by estates in October 2024 dropped by 1.3 per cent to 1.55 tonnes/ha as compared to September 2024 (1.57 tonnes/ha) (Table 4). The average of fresh fruit bunches yields by estates operated in Peninsular Malaysia decreased by 7.4 per cent to 1.63 tonnes/ha (September 2024: 1.76 tonnes/ha) whereas Sabah/Sarawak posted an increase of 4.2 per cent to 1.48 tonnes/ha (September 2024: 1.42 tonnes/ha).
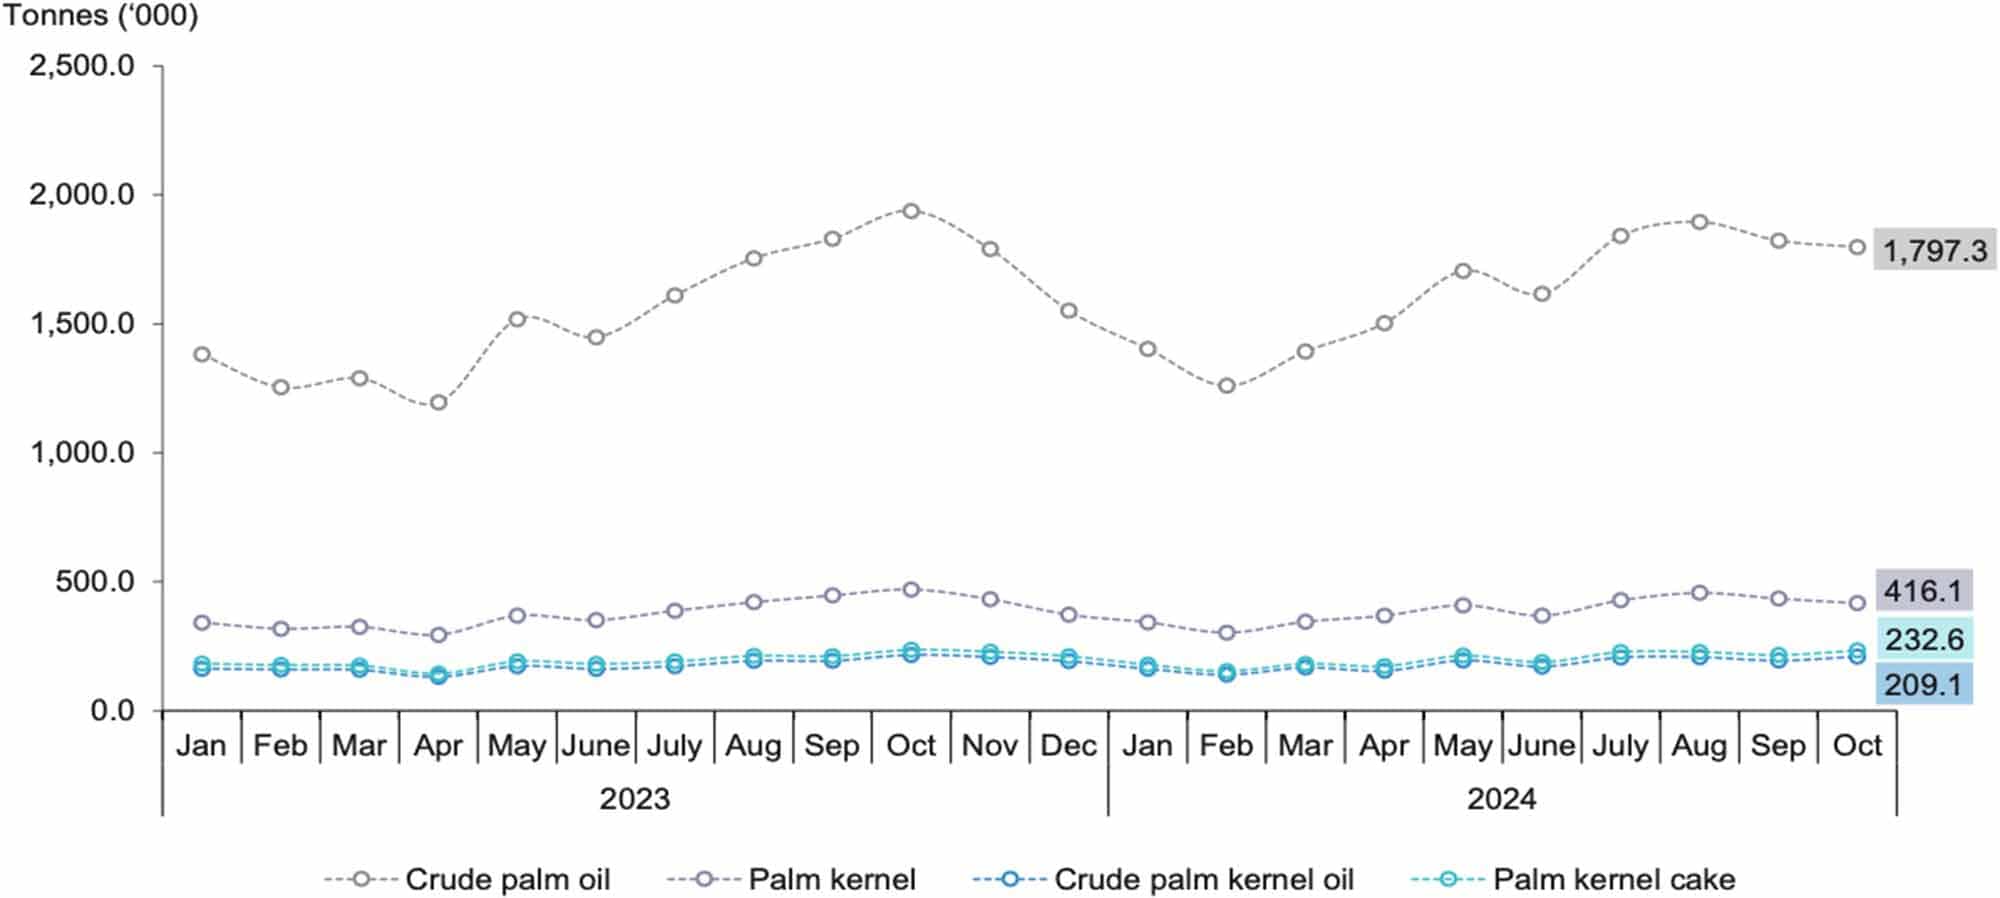
The production of crude palm oil and palm kernel edged down by 1.3 per cent (October 2024: 1,797,348 tonnes, September 2024: 1,821,933 tonnes) and 4.1 per cent (October 2024: 416,058 tonnes, September 2024: 433,785 tonnes) respectively. Contrarily, both Crude palm kernel oil and palm kernel cake showed an increase of 7.9 per cent (October 2024: 209,148 tonnes, September 2024: 193,836 tonnes) and 8.1 per cent (October 2024: 232,637 tonnes, September 2024: 215,166 tonnes) respectively.
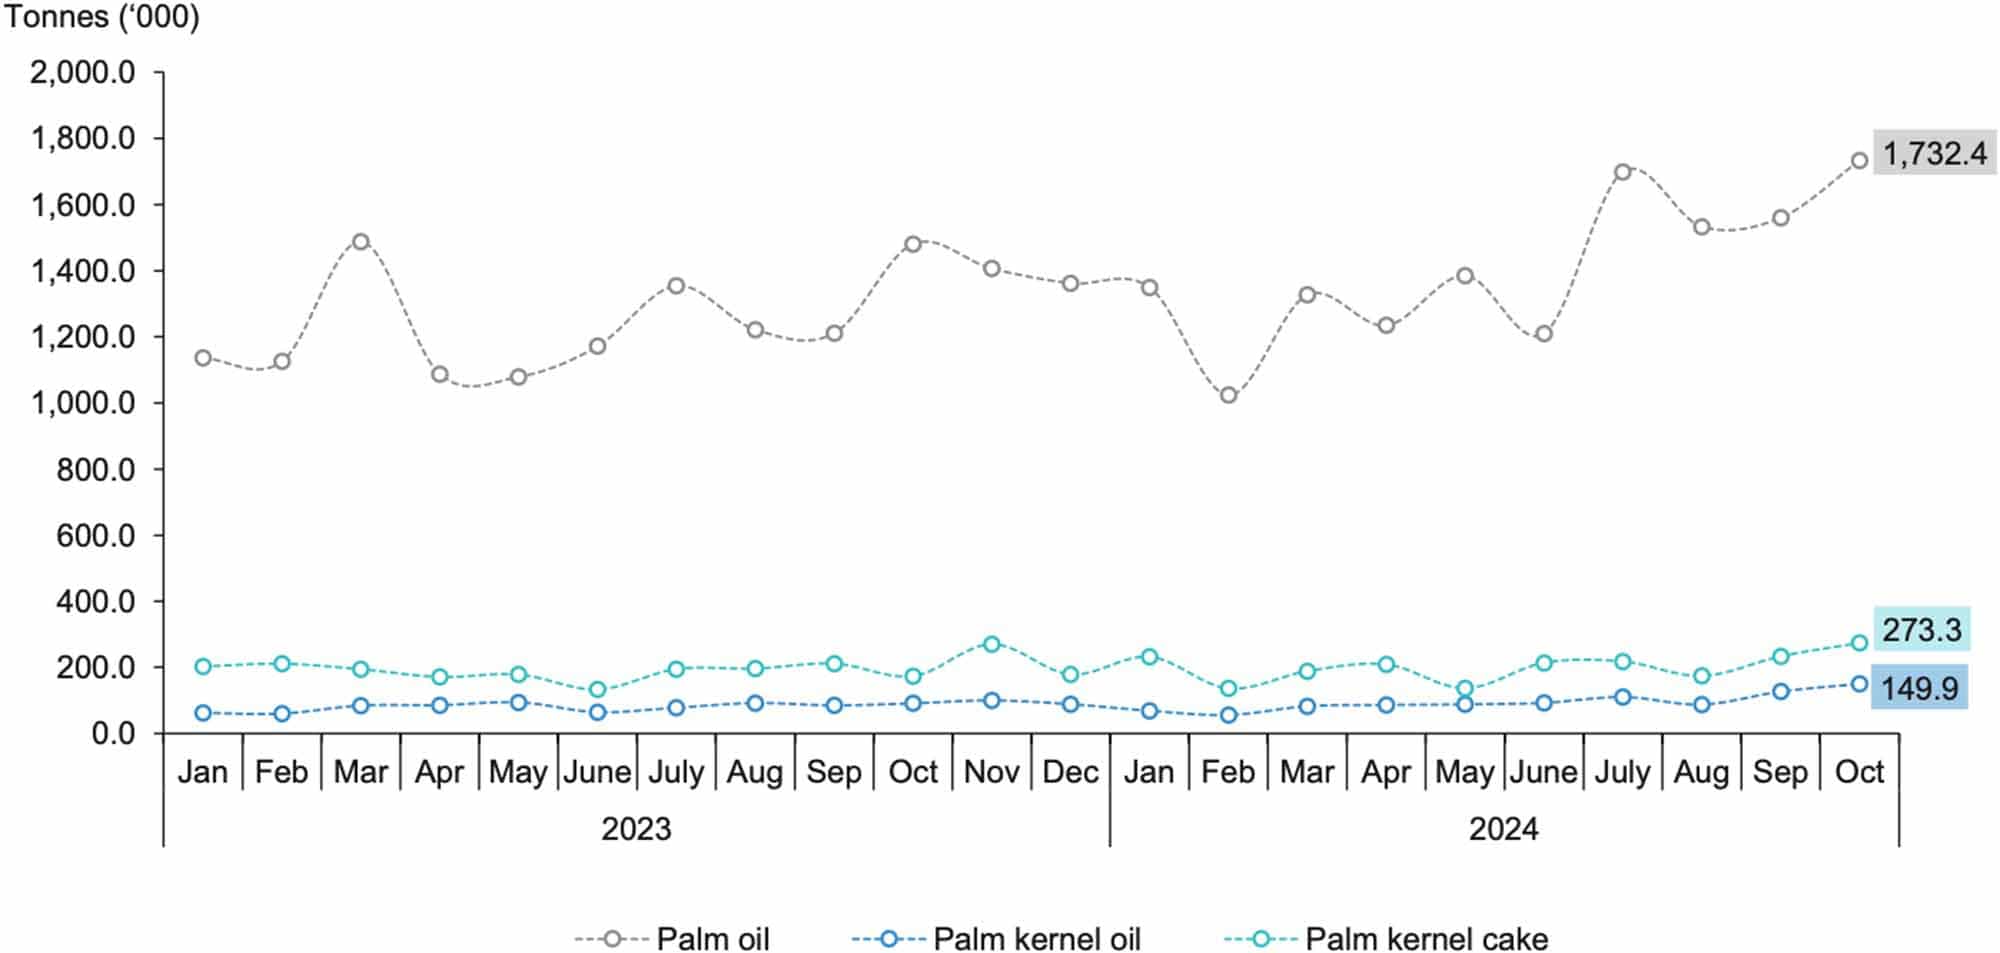
The exports of palm oil continued to record a double digit growth of 11.1 per cent (October 2024: 1,732,448 tonnes, September 2024: 1,559,846 tonnes). The exports of palm kernel oil and palm kernel cake also showed similar trend which increased by 18.5 per cent (October 2024: 149,928 tonnes, September 2024: 126,506 tonnes) and 17.3 per cent (October 2024: 273,307 tonnes, September 2024: 232,944 tonnes) respectively.
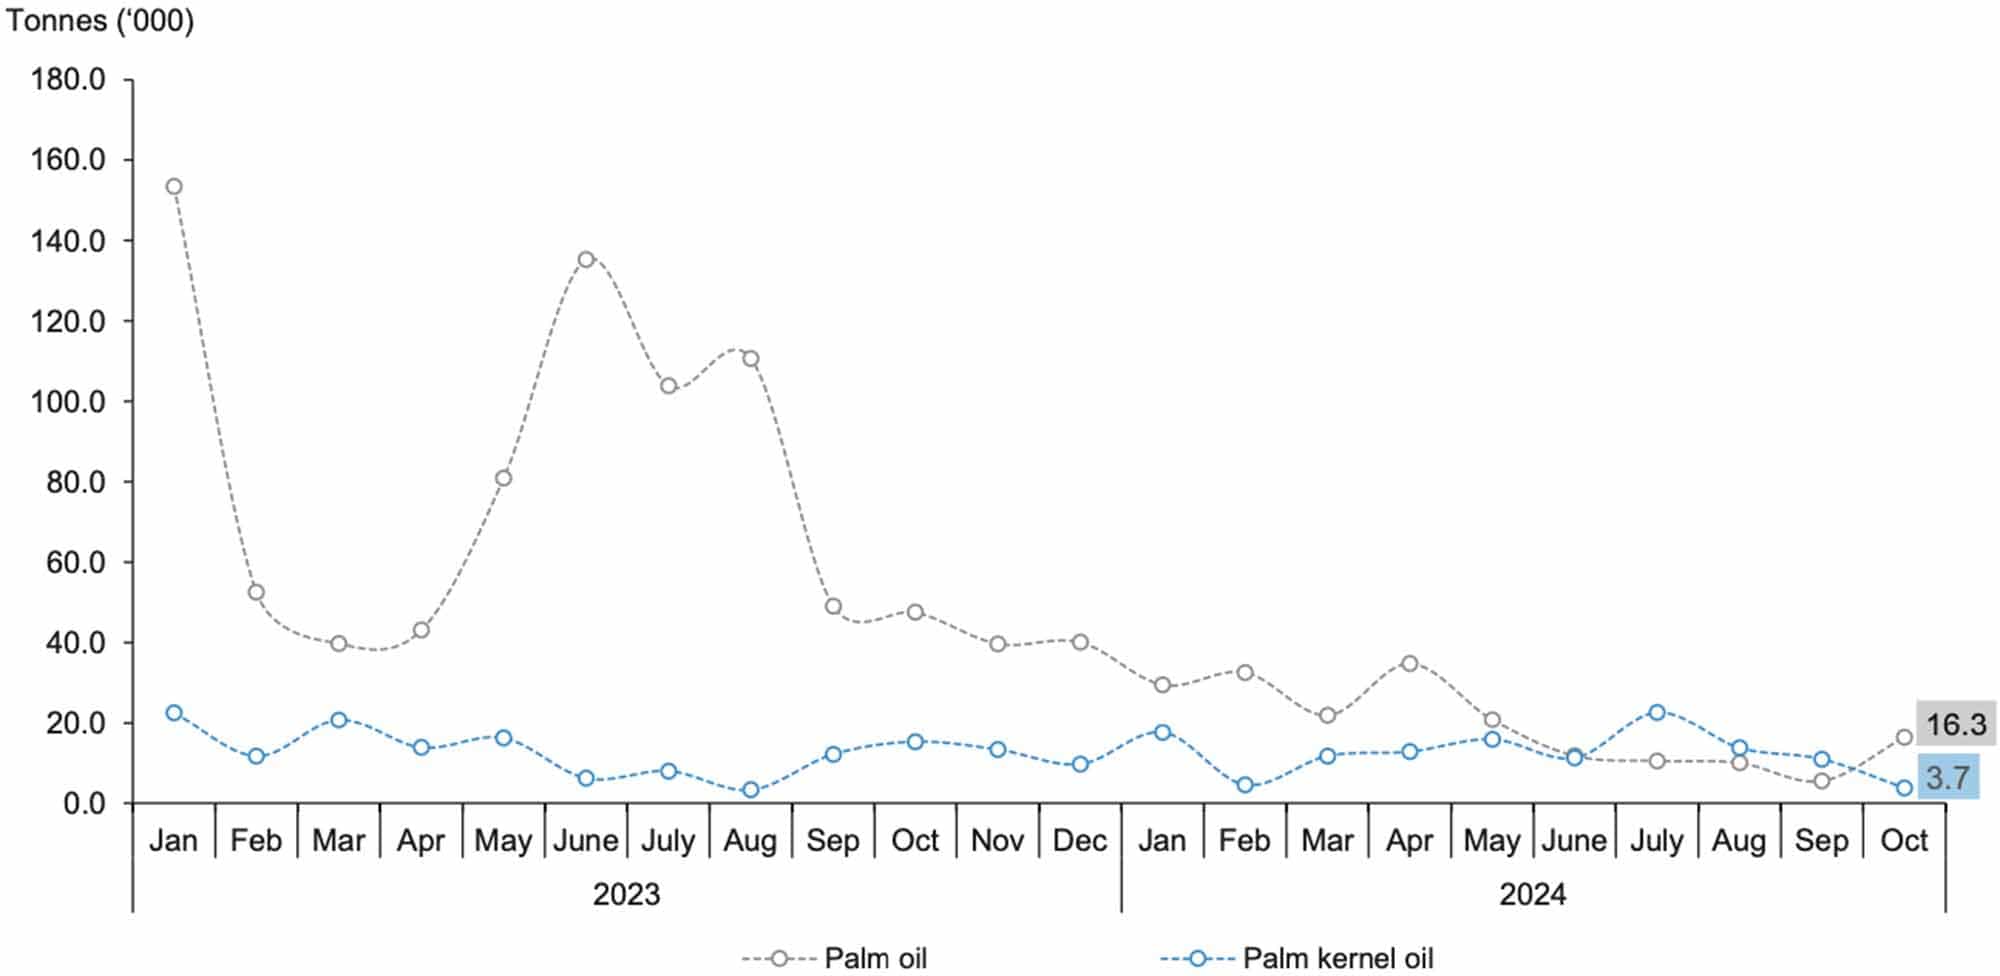
Notably, the imports of palm oil increased by 198.2 per cent to 16,347 tonnes in October 2024 as compared to 5,482 tonnes which recorded in the previous month. The imports of palm kernel oil showed a reduction of 65.6 per cent to 3,749 tonnes (September 2024: 10,887 tonnes).
India imported 359,000 tonnes of palm oil from Malaysia last month, while Malaysia’s palm oil purchases for the 12 months ending October 31 totalled more than 3.2 million tonnes.
India’s vegetable oil imports from Malaysia in October comprised 318,015 tonnes of crude palm oil (CPO), 29,496 tonnes of refined palm oil and 11,497 tonnes of crude palm kernel oil (CPKO), according to figures released by trade group Solvent Extractors’ Association of India (SEA).
India’s overall vegetable oil imports in the 12 months from November to October fell three per cent to 15.96 million tonnes due to the increased of the domestic oilseed production and higher edible oil prices.
Source: ‘India import 359,000 tan minyak sawit dari Malaysia bulan lalu’, BH online 13 November 2024
Natural Rubber (NR) production decreased by 13.9 per cent in September 2024 (30,929 tonnes) as compared to August 2024 (35,908 tonnes) as shown in Chart 1. Year-on-year comparison also showed a reduction of 5.6 per cent in the NR production (September 2023: 32,757 tonnes).
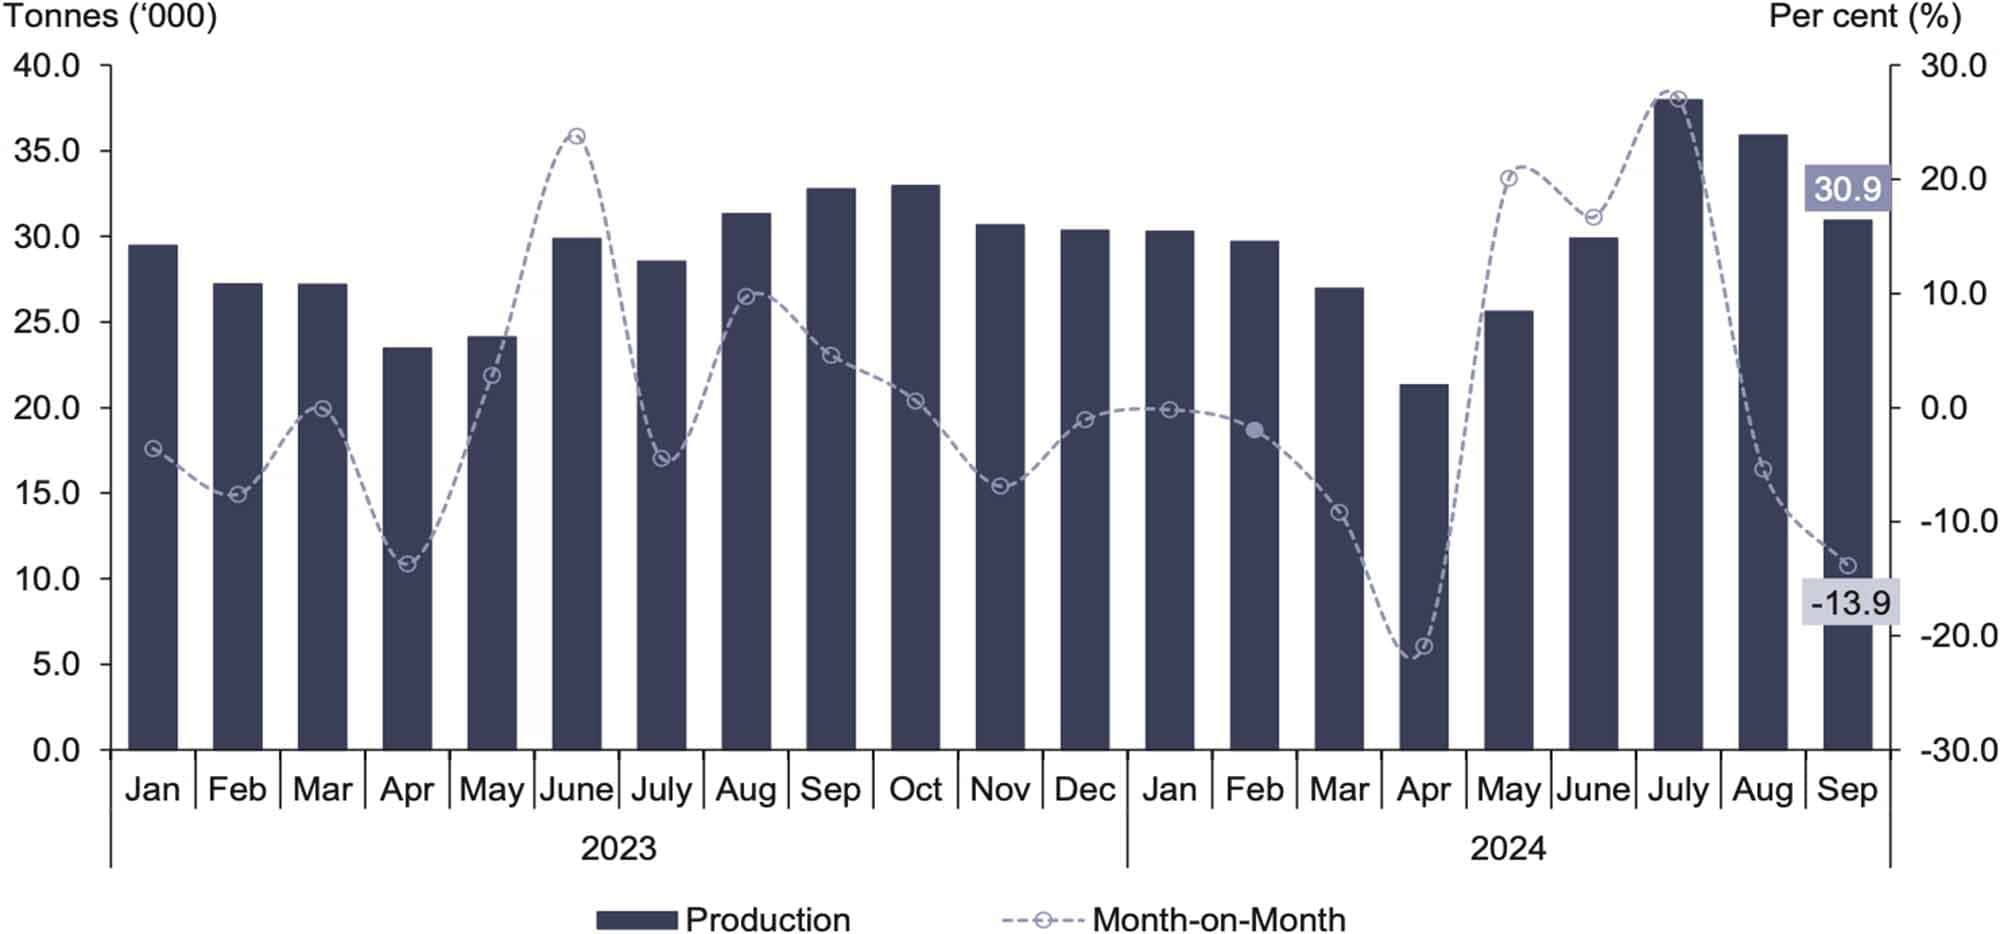
The Smallholdings sector was the main contributor to the production of natural rubber in September 2024 accounted for 85.9 per cent (26,556 tonnes) and the remaining share was from the estate sectorwith 14.1 per cent (4,372 tonnes). Comparison month-on-month in the production of smallholder sector showed a decrease of 16.0 per cent while the estate sector increased 2.0 per cent. Meanwhile, the annual production of smallholdings and estate sectors declined by 5.2 per cent and 7.6 per cent, respectively as compared to September 2023.
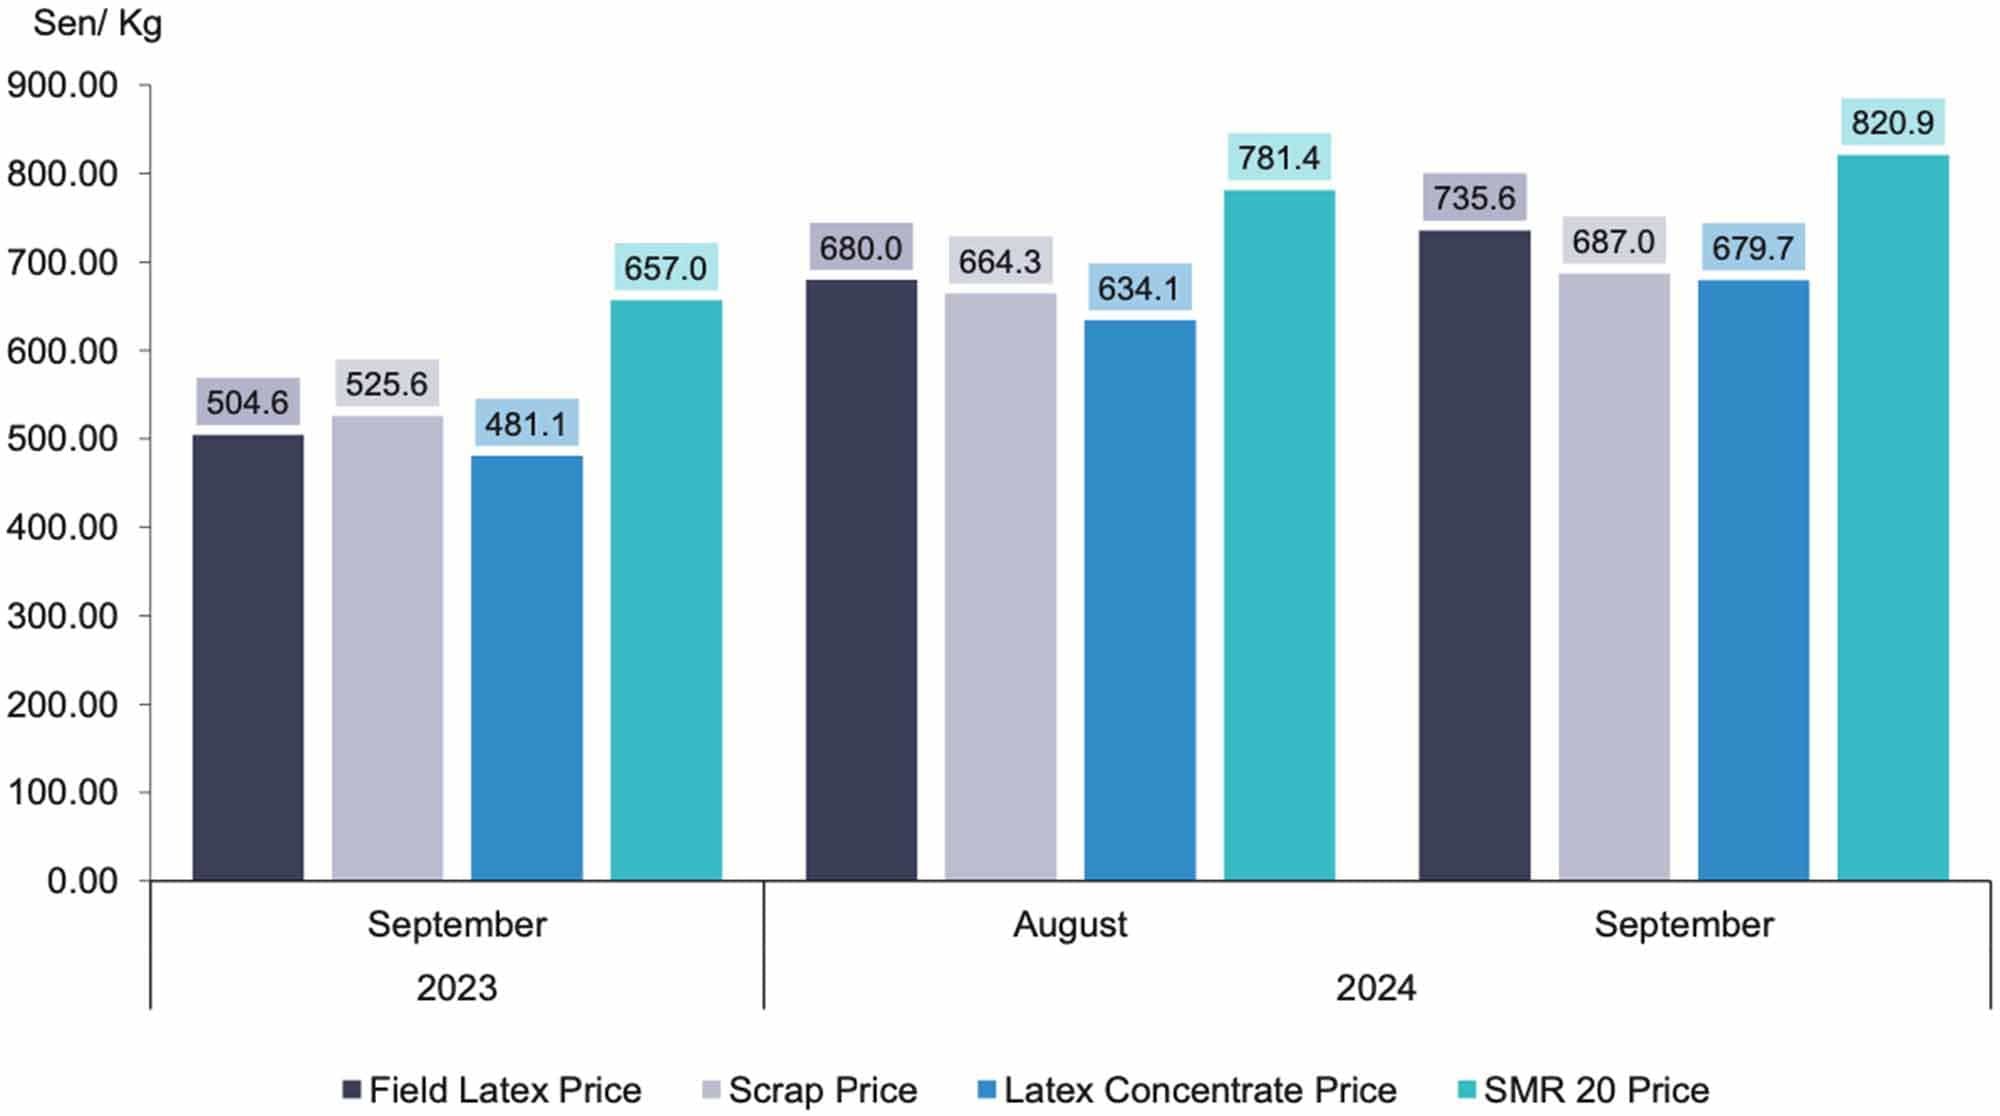
The average monthly price showed that Concentrated Latex recorded an increase of 7.2 per cent (September 2024: 679.65 sen per kg; August 2024: 634.07 sen per kg) while Scrap increased by 3.4 per cent (September 2024: 687.01 sen per kg; August 2024: 664.26 sen per kg). Trend of prices for all Standard Malaysian Rubber (S.M.R) increased between 4.9 per cent and 7.1 per cent. According to the World Bank Commodity Price Data, the prices for TSR 20 (Technically Specified Rubber) increased 9.8 per cent (from USD1.74/kg to USD1.91/kg) and SGP/MYS (Singapore/Malaysia) rose 11.1 per cent (from USD2.39/kg to USD2.65/kg).
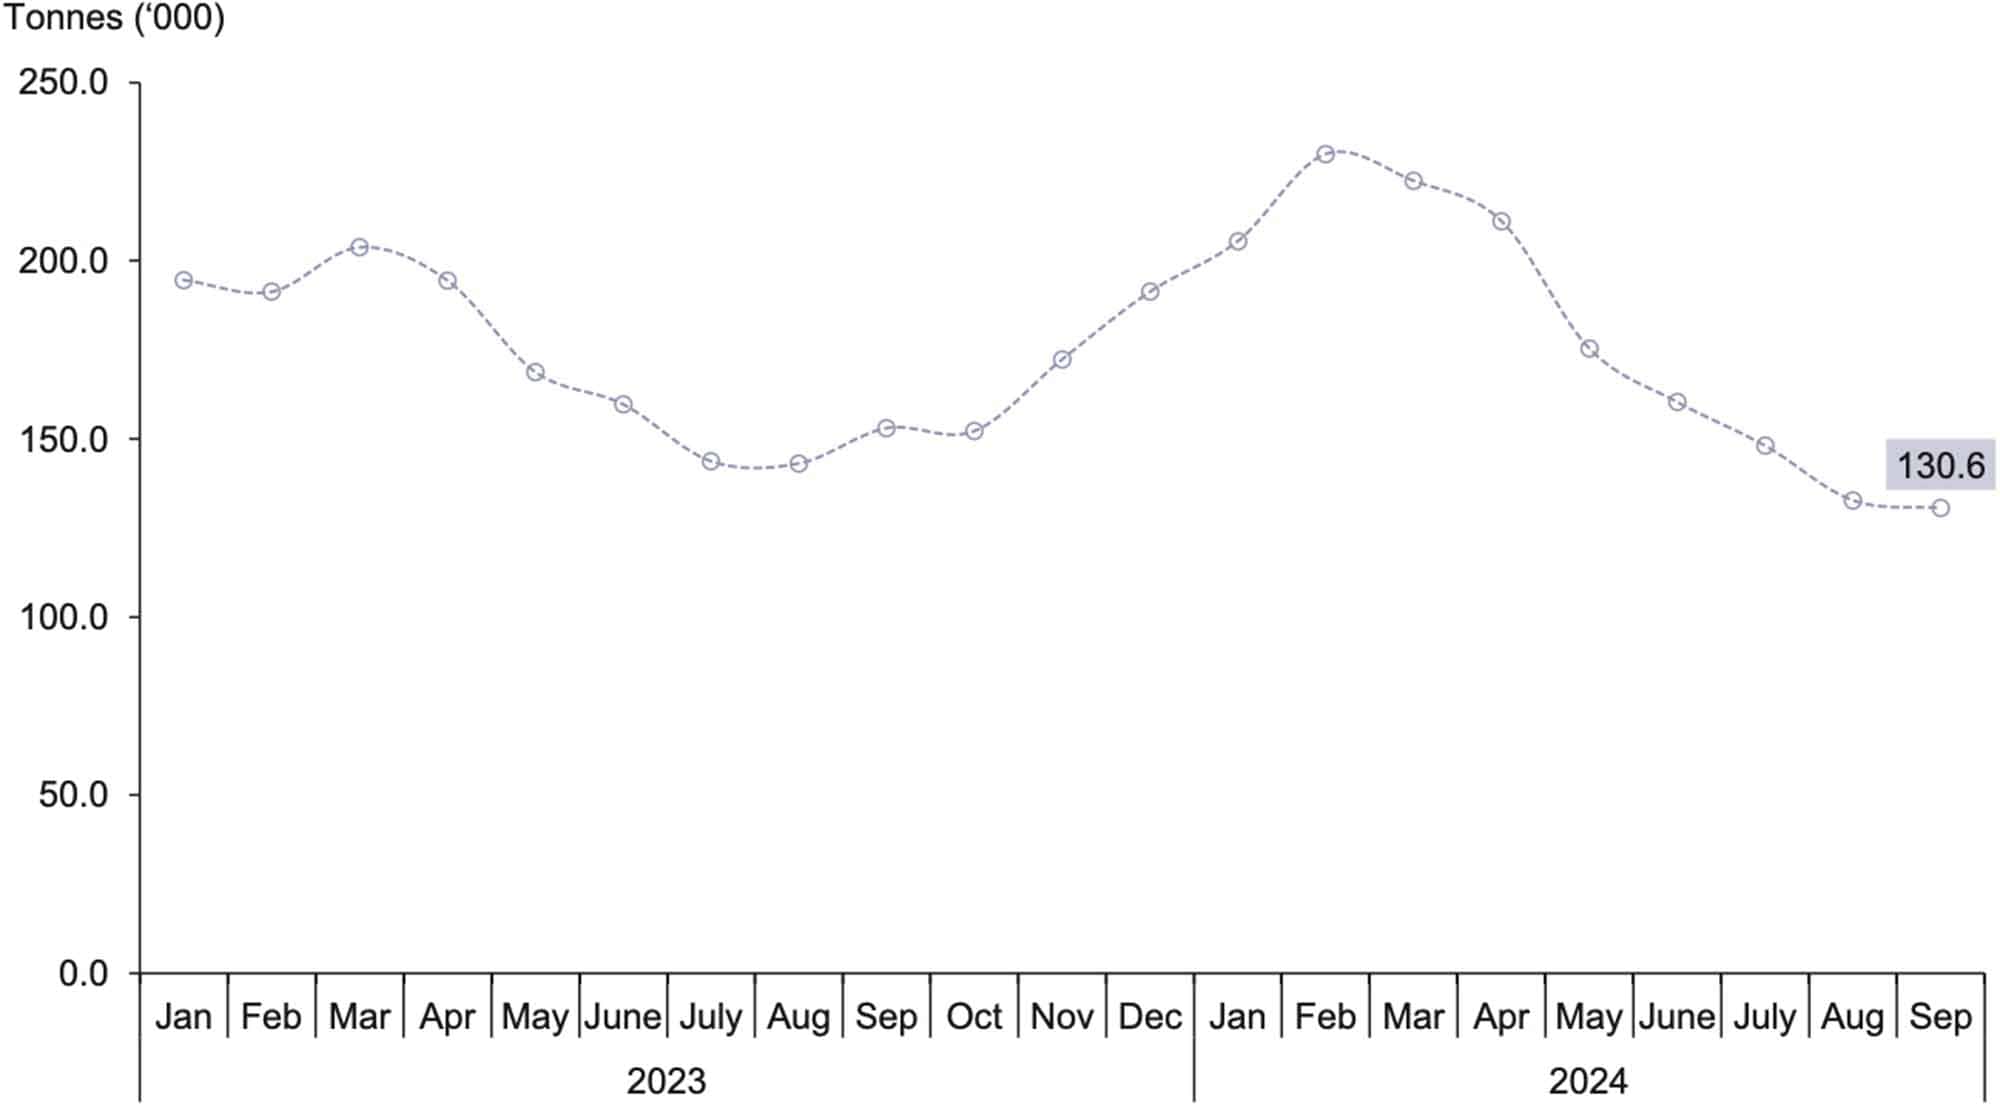
Total stocks of NR in September 2024 decreased by 1.6 per cent to 130,608 tonnes as compared to 132,755 tonnes in August 2024. Similarly, the year-on-year comparison also recorded a decrease of 14.6 per cent in stock as against 153,011 tonnes in September 2023.
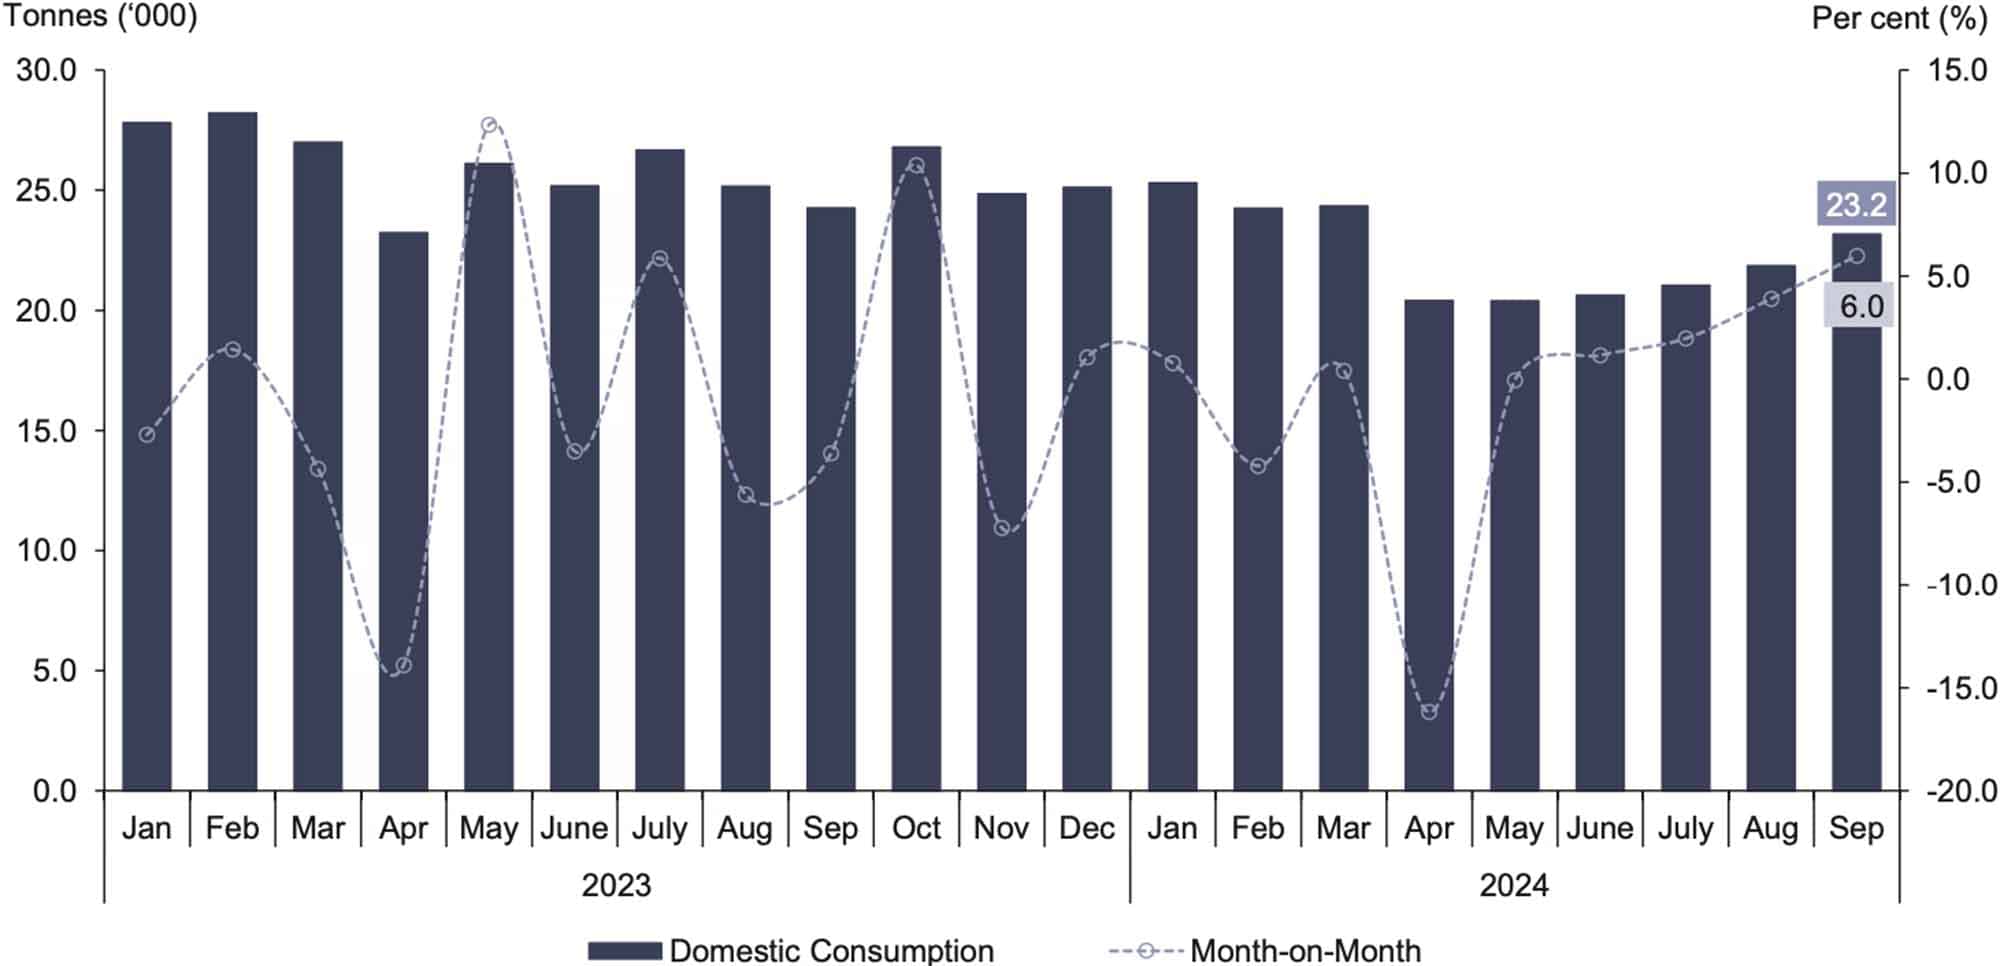
The Domestic consumption went up by 6.0 per cent to 23,169 tonnes as compared to 21,861 tonnes in August 2024. The consumption on an annual basis fell by 4.5 per cent (September 2023: 24,263 tonnes).
Malaysia’s exports of NR amounted to 39,915 tonnes in September 2024, decreased 30.6 per cent as against August 2024 (57,482 tonnes). China remained as the main destination for NR exports which accounted for 32.1 per cent of the total exports in September 2024, followed by the United Arab Emirates (15.6%), Germany (11.7%), the United States (6.6%) and Portugal (5.3%).
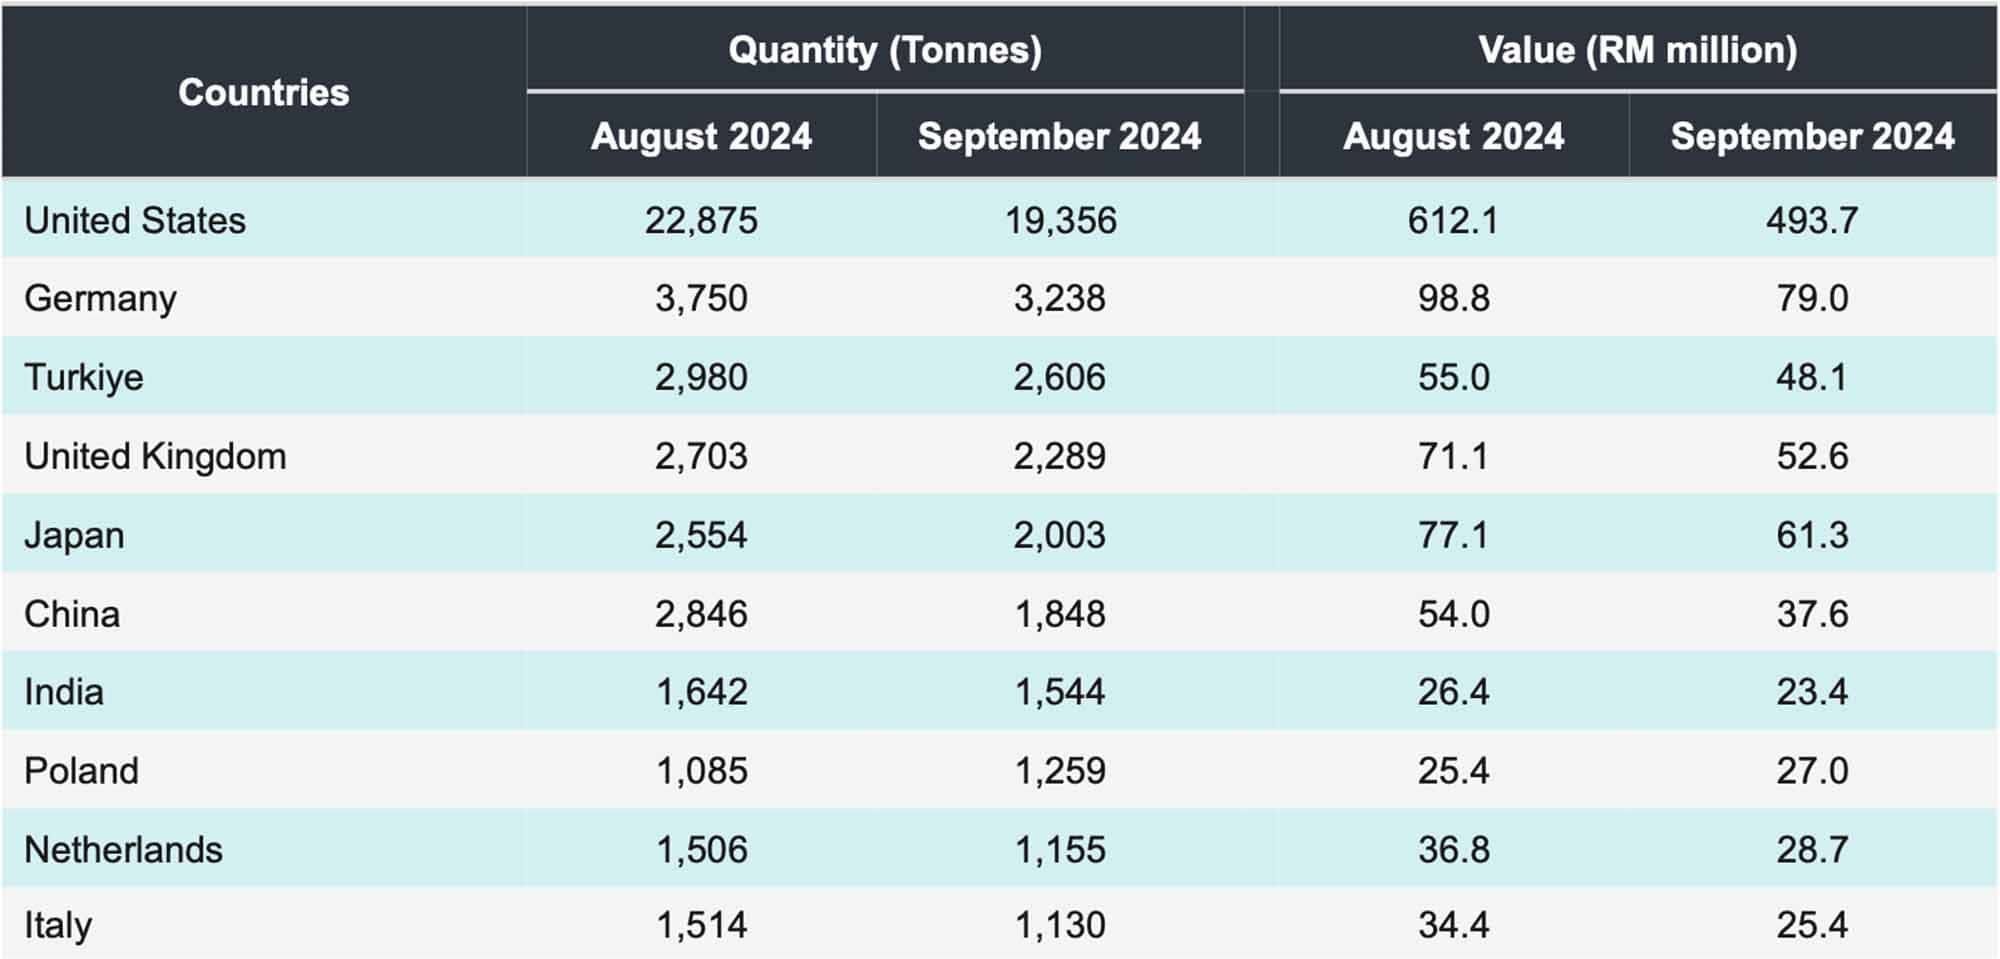
Gloves were the main exports of rubber-based products with a value of RM1.2 billion, a decrease of 23.0 per cent as compared to August 2024 (RM1.6 billion). The main exporting countries for rubber gloves were the U.S.A (19,356 tonnes), Germany (3,238 tonnes) and Turkiye (2,606 tonnes) as shown in Table 5.
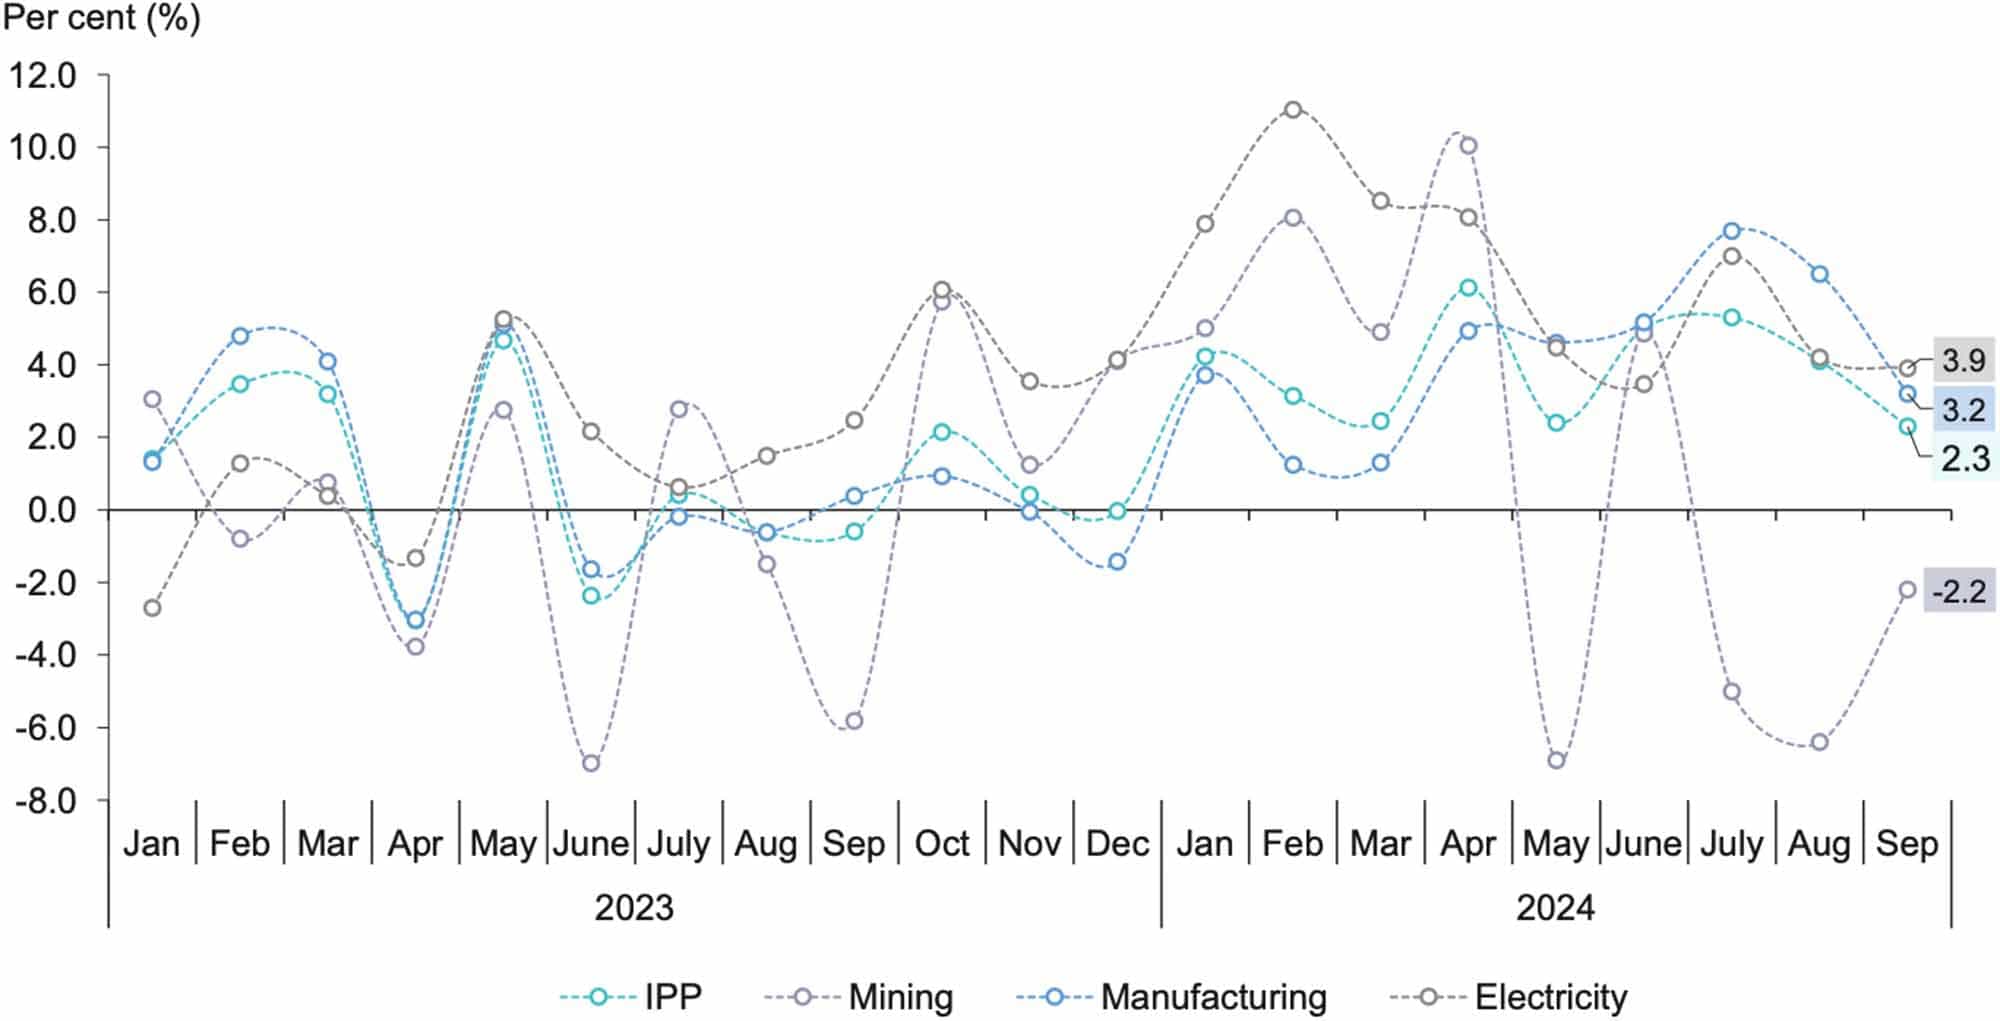
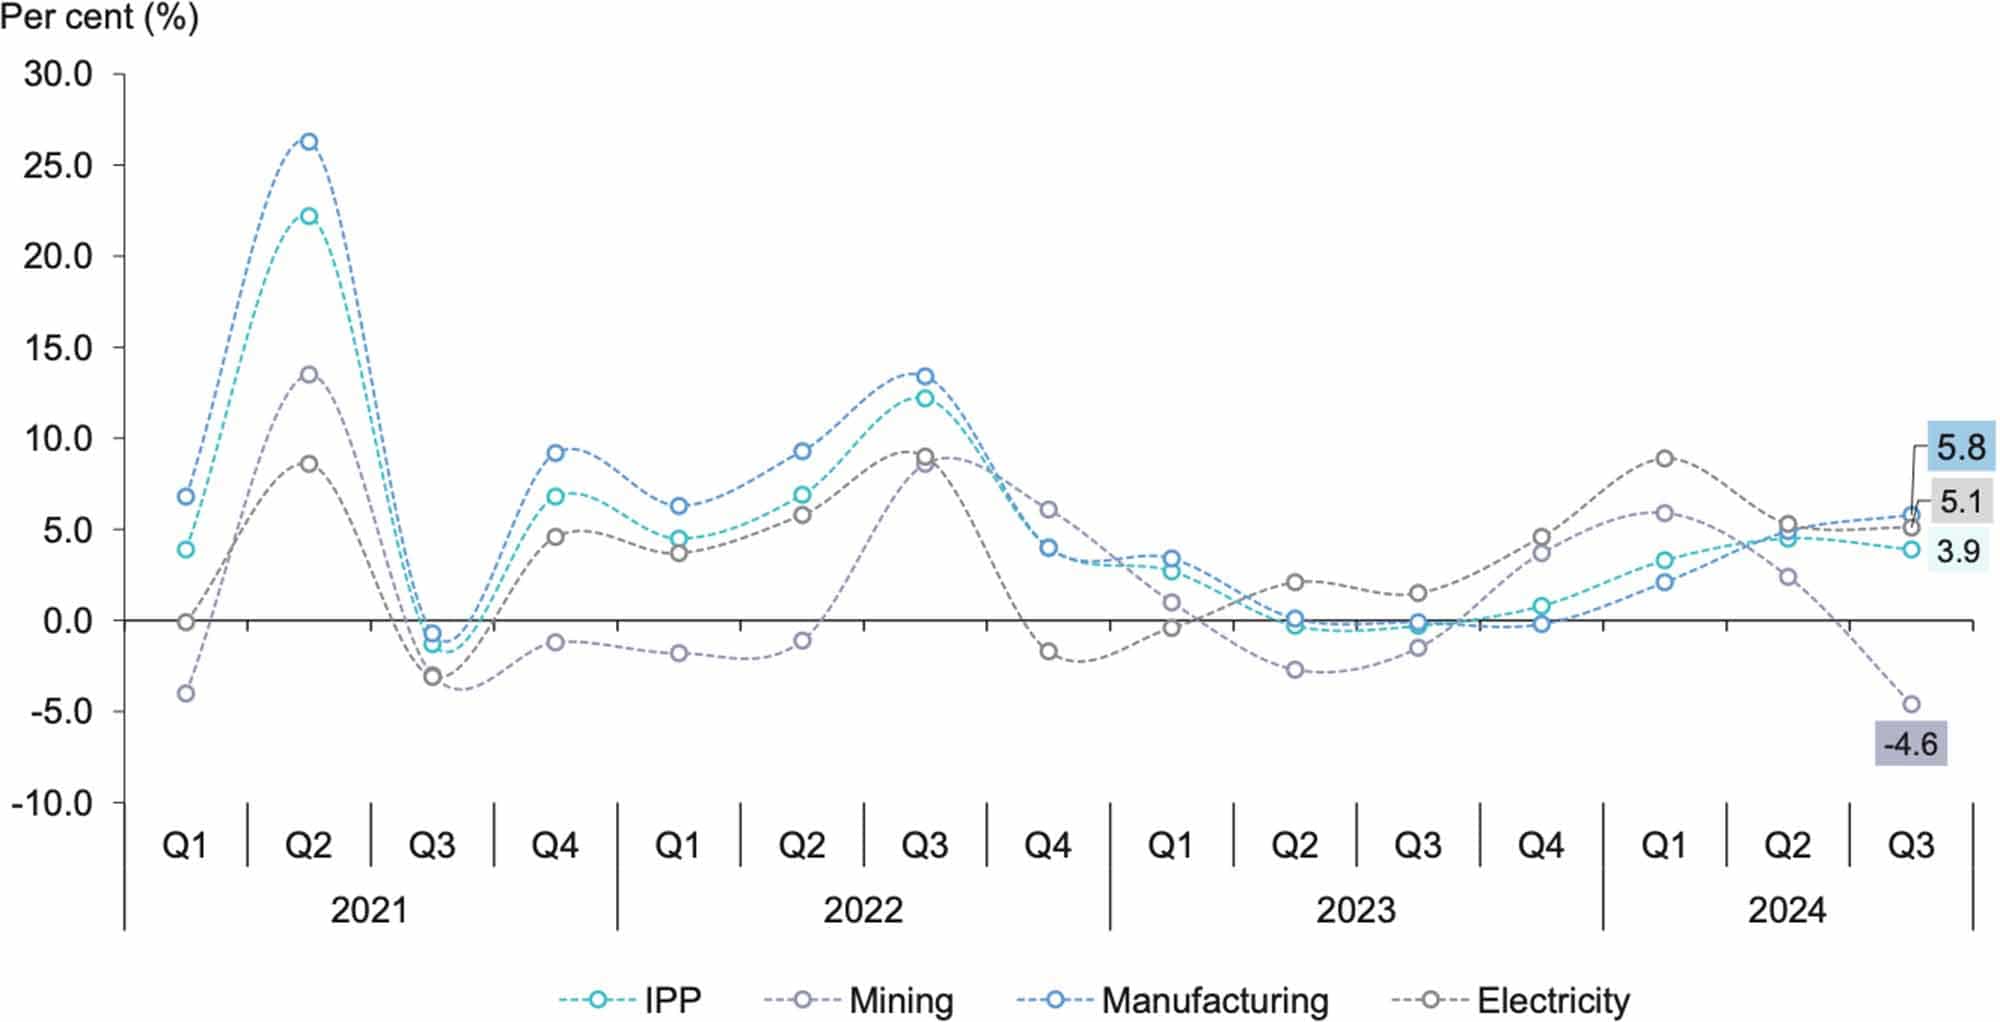
The Industrial Production Index (IPI) grew modestly, increased 2.3 per cent year-on-year in September 2024, following a growth of 4.1 per cent in the preceding month as shown in Chart 12. The output growth in the Manufacturing led the way, rising by 3.2 per cent (August 2024: 6.5%) coupled with the Electricity sector which rose by 3.9 per cent (August 2024: 4.2%). Meanwhile, the production of the Mining sector continued to decline for the third consecutive month, recording negative 2.2 per cent (August 2024: -6.4%). In comparison to the previous month, the IPI fell by 0.7 per cent compared to a 1.7 per cent increase in September 2024.
The rise in output of the Manufacturing sector in September 2024 was primarily driven by expansion in export oriented industries at 3.4 per cent, slower than 6.3 per cent recorded in the preceding month. The expansion of production was mainly supported by the steady growth of 8.6 per cent in the Manufacture of rubber product (August 2024: 11.1%); followed by the Manufacture of computer, electronics and optical products which increased by 5.9 per cent (August 2024: 8.7%). On a month-on-month basis, the export-oriented industries dropped by 1.6 per cent, after registered 3.0 per cent in August 2024.
The domestic-oriented industries grew by 2.7 per cent as against 7.1 per cent recorded in August 2024. The slower growth was primarily due to 14.9 per cent decline in the Manufacture of motor vehicles, trailers & semi-trailers (August 2024: 7.7%) along with a moderation in the Manufacture of food processing products which grew by 3.5 per cent (August 2024: 4.4%).
The output in the Mining sector shrank by -2.2 per cent in September 2024 (August 2024: -6.4%). The decline was primarily influenced by the Crude Oil & Condensate production, declined further to -11.4 per cent (August 2024: -5.7%), offset by a rebound in Natural Gas production which grew by 4.5 per cent (August 2024: -7.0%) during the month. Meanwhile, the generation of Electricity grew by 3.9 per cent year-on-year in September 2024 (August 2024: 4.2%). Compared to August 2024, the Mining index rose by 2.8 per cent while the Electricity index dropped by -3.8 per cent.
Looking at the performance of several countries, the IPI showed positive growth in China, Singapore, Vietnam, and Taiwan, Province of China. Conversely, the United States, South Korea, Thailand and Japan experienced a decline in IPI in September 2024.
For the third quarter of 2024, the IPI increased by 3.9 per cent compared to 4.5 per cent recorded in the second quarter of 2024 as depicted in Chart 13. The uptick was driven by the Manufacturing sector at 5.8 per cent growth, advancing from 4.9 per cent in the second quarter of 2024. In contrast, the IPI for Mining sector declined by -4.6 per cent (Q2 2024: 2.4%) while the Electricity sector posted a growth of 5.1 per cent (Q2 2024: 5.3%). On a quarter-on quarter basis, the IPI turned upward by 3.7 per cent.
Meanwhile, throughout the first nine months this year (January – September 2024), the IPI improved by 3.9 per cent (January – September 2023: 0.7%) with all sectors posting an expansion, namely the Mining index (1.4%); Manufacturing index (4.3%); and Electricity index (6.4%).
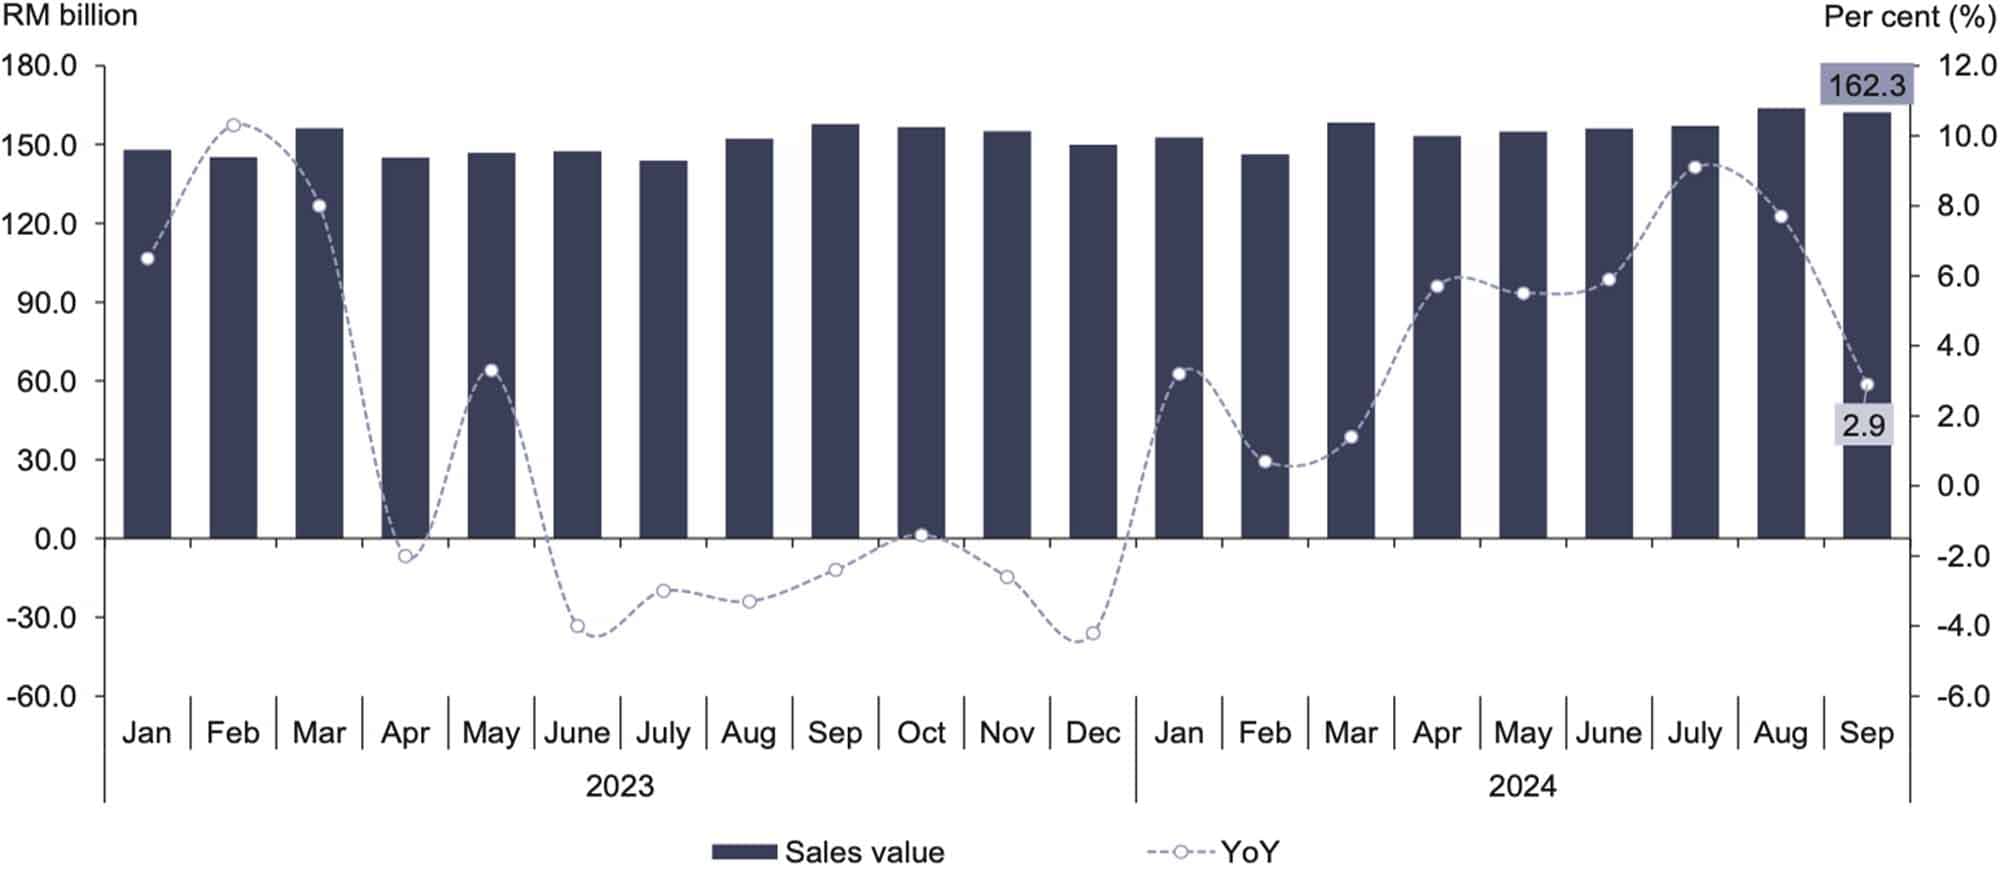
The Manufacturing sector’s sales value reached RM162.3 billion, achieving 2.9 per cent year-on-year, grew at a slower pace from the 7.7 per cent recorded in the previous month (Chart 14). This was primarily driven by the Electrical & electronics products sub-sector, which grew by 5.8 per cent after a 10.3 per cent increase in August 2024. The growth was also supported by the Food, beverages & tobacco sub-sector, with an increase of 5.6 per cent, and the Non-metallic mineral products, basic metal & fabricated metal products, which rose by 5.1 per cent. On a month-on-month basis, the sales value declined by 1.0 per cent from RM163.9 billion in August 2024.
The sales value for the export-oriented industries, which accounted for 72.6 per cent, moderated to 3.0 per cent in September 2024 (August 2024: 7.7%). The Manufacture of computer, electronics & optical products (6.9%); and the Manufacture of vegetable & animal oils & fats (4.6%) were the key contributors to the growth of export-oriented industries during the month. Meanwhile, domestic-oriented industries grew by 2.5 per cent (August 2024: 7.6%) impacted by the decline in the sales value of the Manufacture of motor vehicles, trailers & semi-trailers industry at -7.3 per cent, as against 10.4 per cent increase in the preceding month. Offsetting the decline, the Manufacture of food processing products (6.9%) sustained the growth momentum; followed by the Manufacture of fabricated metal products, except machinery & equipment (7.9%) and the Manufacture of other non-metallic mineral products (4.1%). As compared to the previous month, the sales value of both export and domestic oriented industries dropped by -1.1 per cent and -0.7 per cent, respectively.
There were 2.39 million employees in the Manufacturing sector in September 2024, marking a 0.8 per cent increase compared to a 1.0 per cent growth in August 2024. The increase was observed largely in the Food, beverages & tobacco (2.4%); and the Non-metallic mineral products, basic metal & fabricated metal products (1.8%). In comparison with the preceding month, the number of employees in this sector augmented by 0.5 per cent, improved against 0.4 per cent registered in August 2024.
In September 2024, salaries & wages in the Manufacturing sector rose by 1.2 per cent, reaching RM8.23 billion. Compared to the previous month, salaries & wages increased by 1.4 per cent, following a marginal drop of 0.1 per cent in August 2024. This led to an increase on average monthly salaries & wages per employee by 0.4 per cent year-on-year to RM3,442. Simultaneously, the sales value per employee rose by 2.1 per cent to record RM67,861.
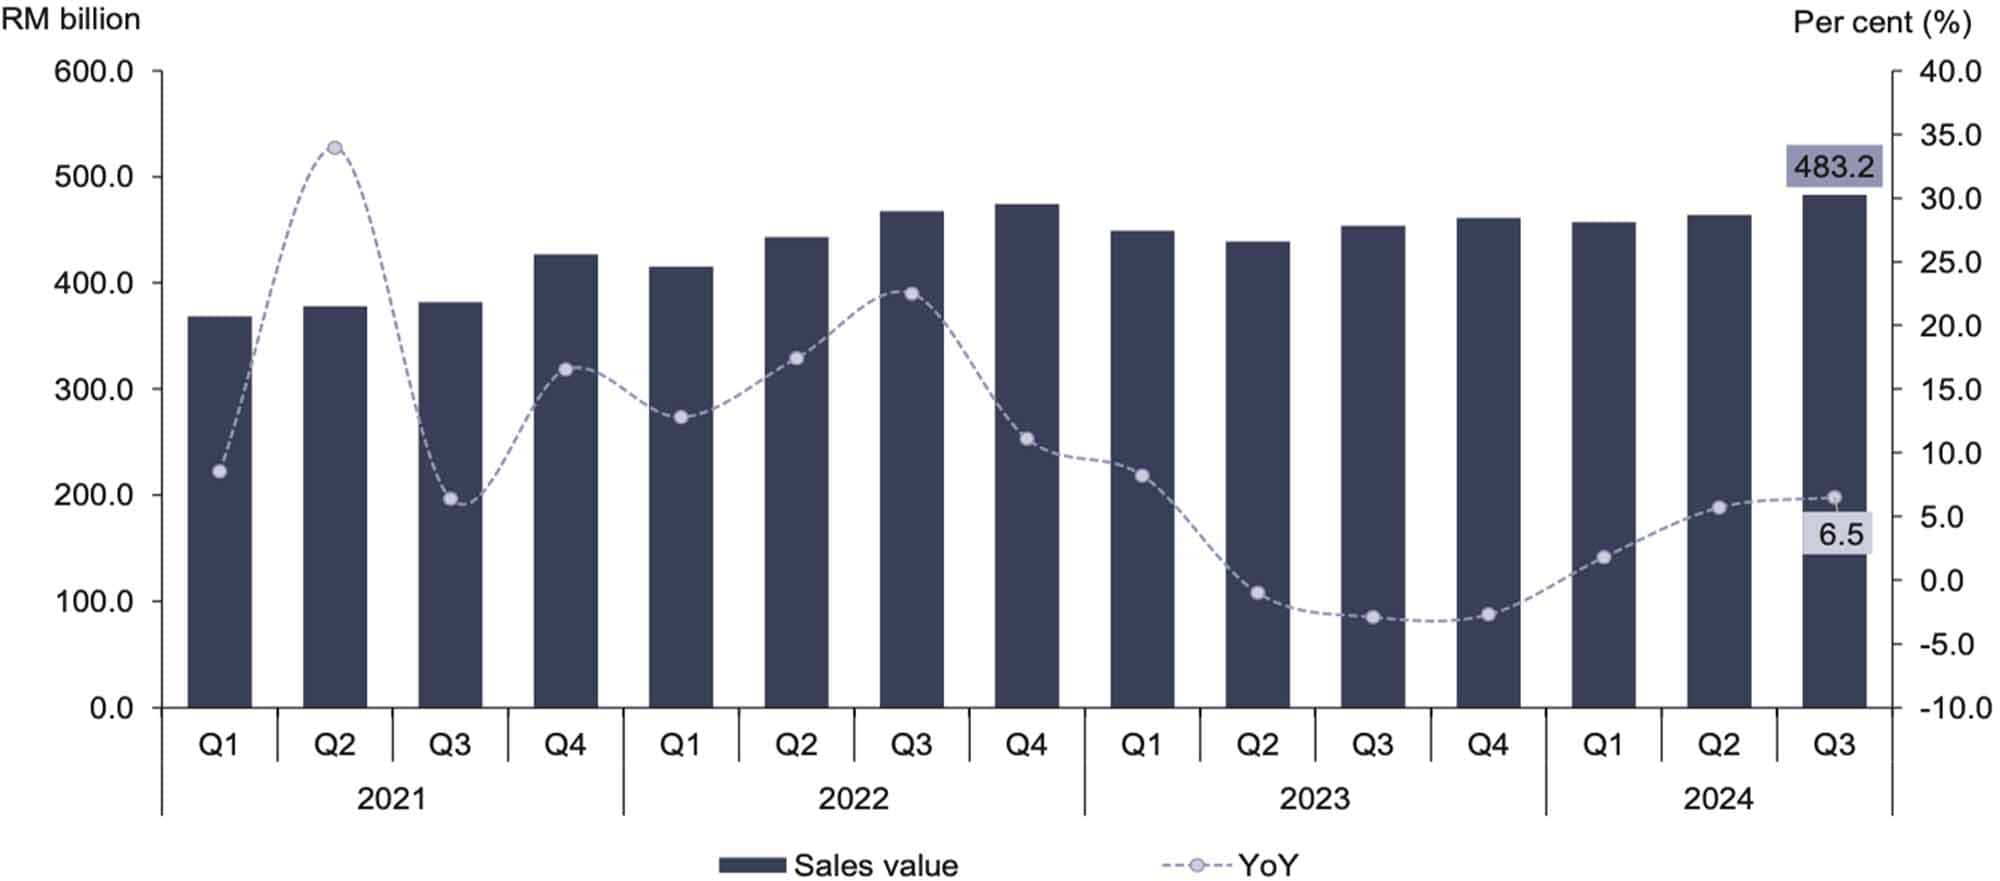
For the third quarter of 2024, sales of the Manufacturing sector reached RM483.2 billion, reflecting a growth of 6.5 per cent (Q2 2024: 5.7%) as in Chart 4. The increase was primarily attributable to the Food, beverages & tobacco sub-sector (12.3%); and Electrical & electronics products (8.1%) sub-sectors. Furthermore, the number of employees and salaries & wages during the quarter rose by 0.8 per cent (Q2 2024: 1.0%) and 1.7 per cent (Q2 2024: 1.4%), respectively.
In the meantime, throughout the first nine months this year (January – September 2024), the sales value of the Manufacturing sector reached RM1,404.8 billion, an increased by 4.6 per cent as compared to the same period of 2023 (January – September 2023: 1.2%). The number of employees rose by 0.8 per cent to a total of 2.39 million persons, while salaries & wages grew by 1.4 per cent to RM73.8 billion. Subsequently, the sales value per employee stood at RM587,494, reflecting a growth of 3.8 per cent.
Performance In the upcoming months, Malaysia’s Manufacturing sector is projected to maintain its growth, supported by the consistent export expansion despite a decline in the motor vehicle's output.
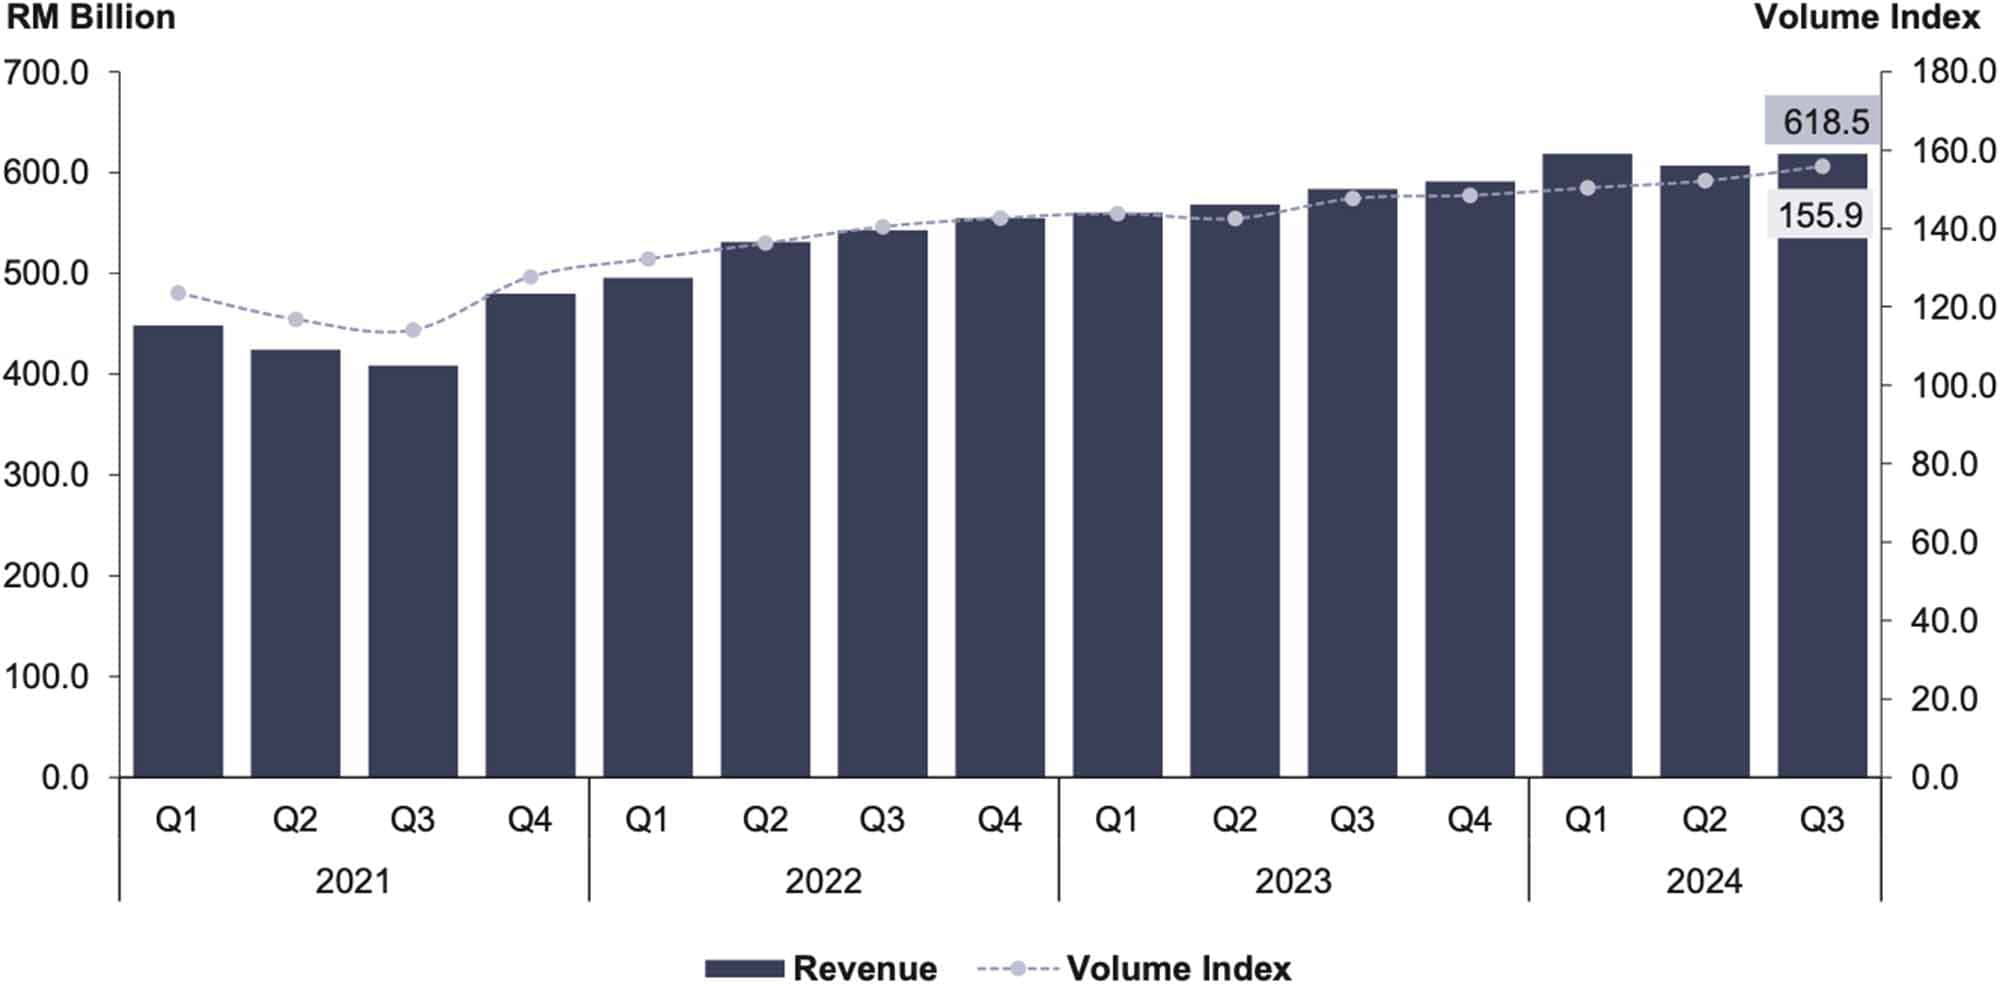
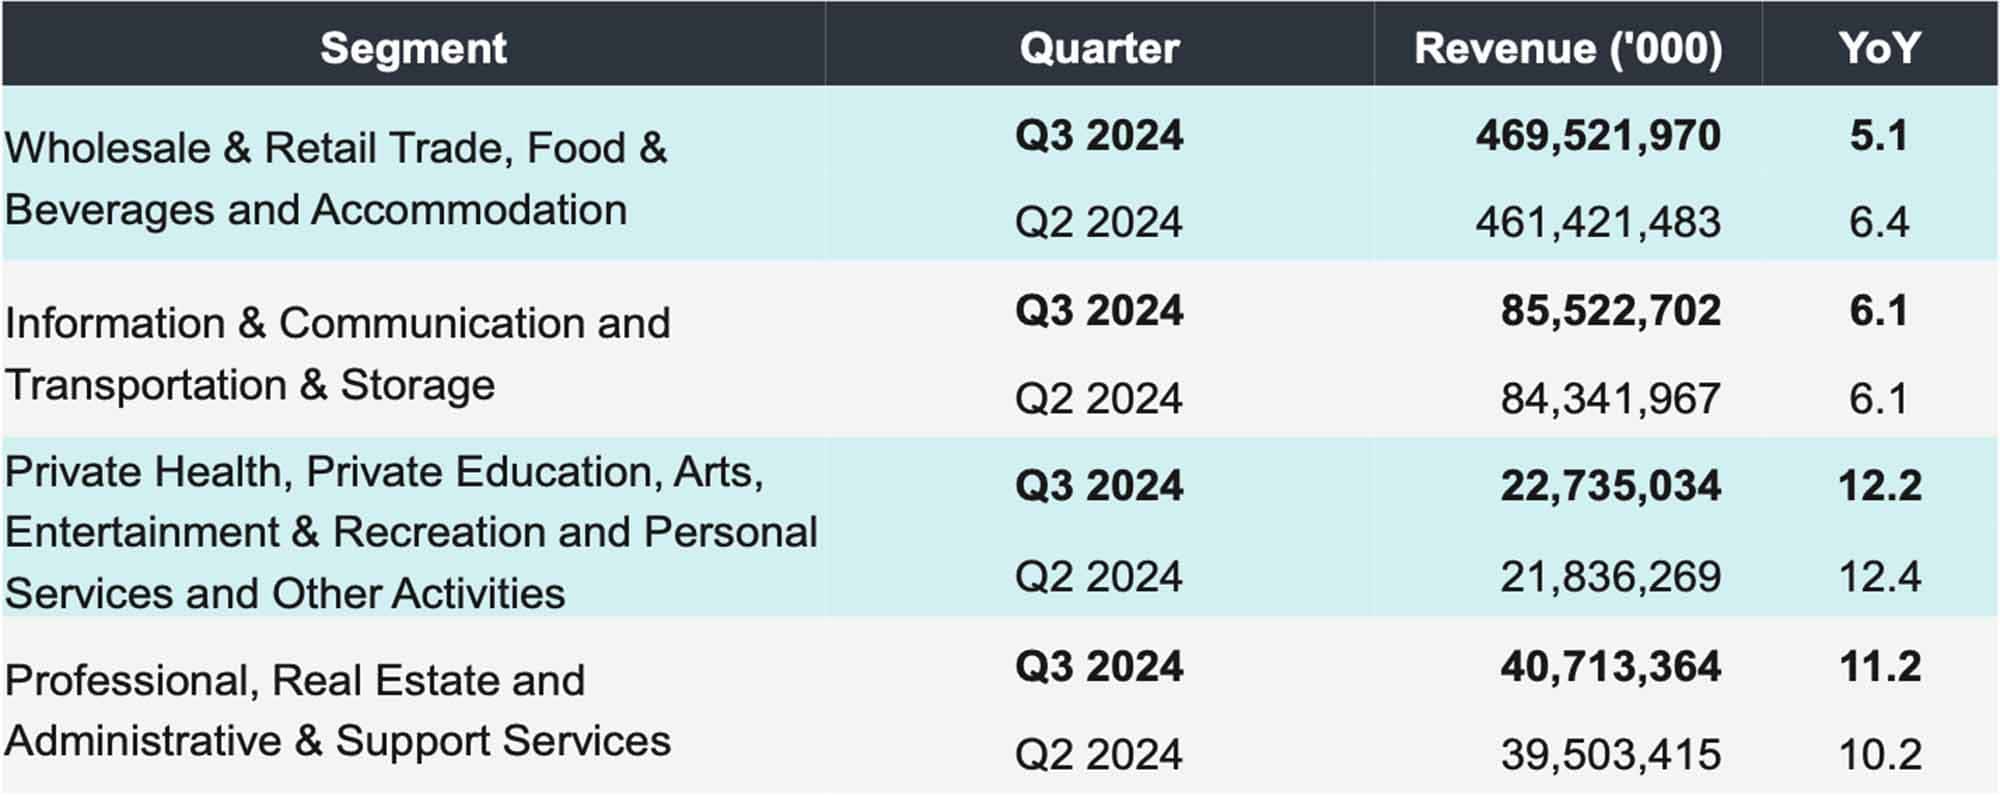
In the third quarter of 2024, Malaysia’s Services sector recorded a strong performance, with a revenue amounted to RM618.5 billion, marking a 5.9 per cent increase as compared to the previous year (Chart 16). Meanwhile, the Services Volume Index rose by 5.6 per cent, reaching 155.9 points. These results reflect the sector’s robust performance, with quarter-on-quarter comparisons indicating a 1.9 per cent increase in revenue and a 2.5 per cent rise in the volume index, underscoring the continued strength and positive momentum in the Services sector.
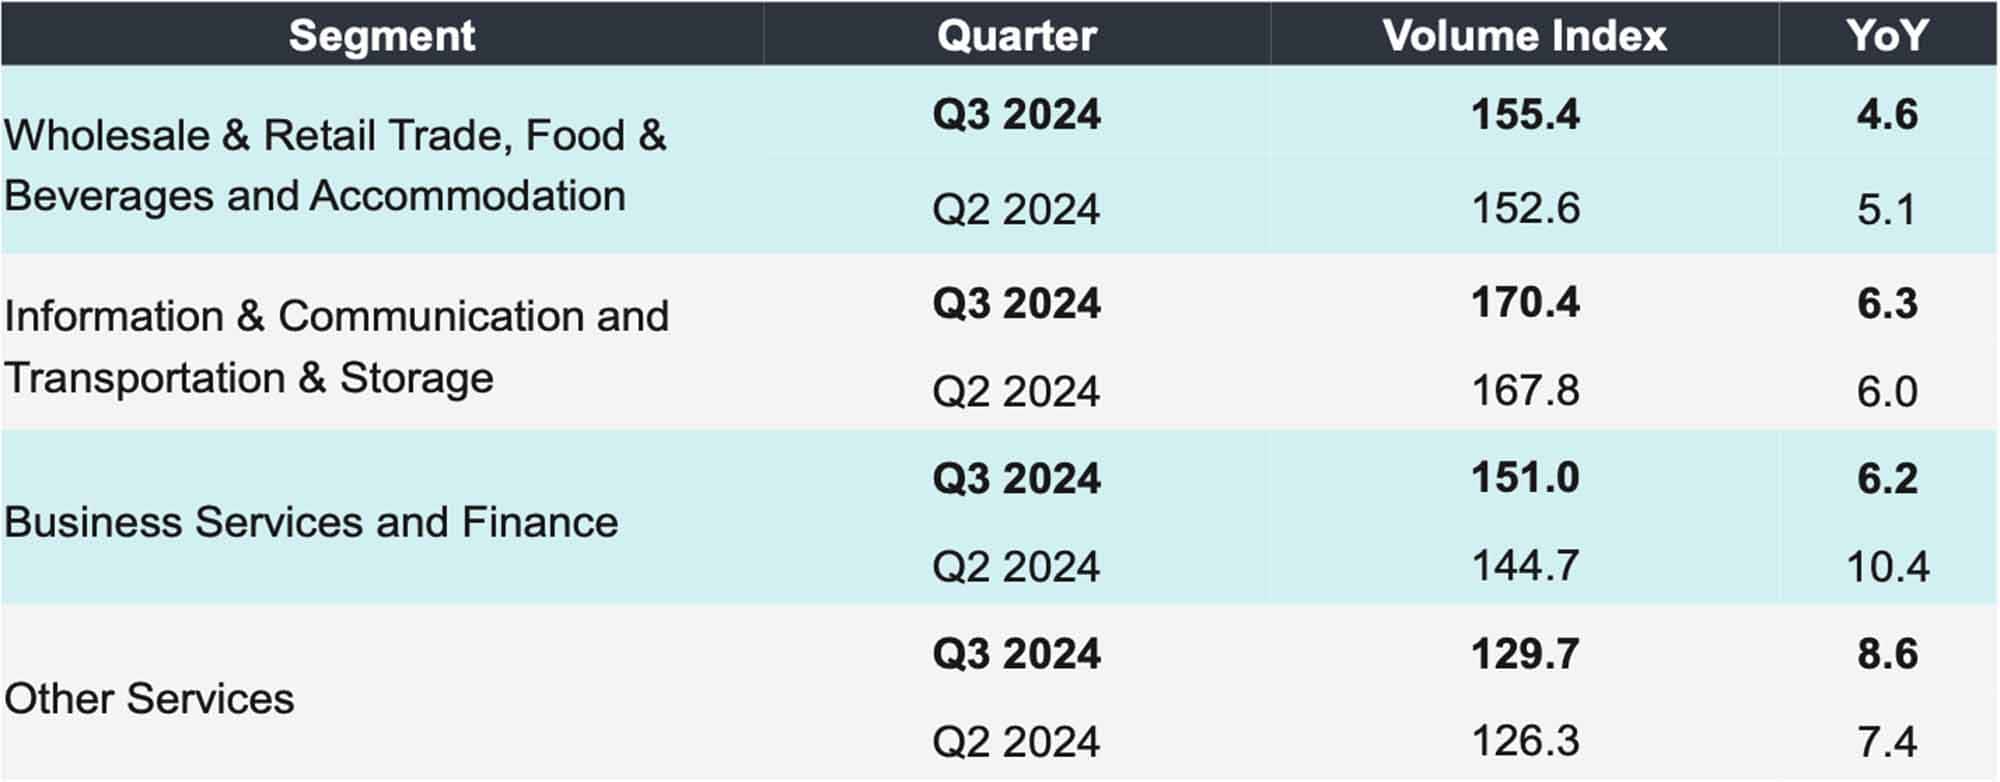
Looking at performance analysis by segment, the Wholesale & Retail Trade, Food & Beverage and Accommodation increased by 5.1 per cent year-on-year to RM469.5 billion as compared to the same quarter last year (Table 1). This was supported by the favourable performance in Wholesale and Retail Trade (+5.1%); Food and Beverage (+5.4%); and Accommodation (+13.0%) sub-sectors. This growth also reflects the rising numbers of international and domestic tourists, which in turn have fuelled consumer spending and heightened demand across this segment, reinforcing tourism’s key role in sustaining the sector’s performance. Meanwhile, the Volume Index increased by 4.6 per cent to register 155.4 points (Table 6).
For the performance of Wholesale and Retail Trade sub-sector by activity, the Retail Trade activity grew at 5.9 per cent to RM192.0 billion. This was attributed to the Retail Sales in Non-specialised Stores (+7.2%), Retail Sales of Other Goods in Specialised Stores (+6.0%), and Retail Sale of Automotive Fuel in Specialised Stores (+6.3%). Meanwhile, sales value for Wholesale Trade activities increased by 4.3 per cent to RM199.3 billion, which was mainly contributed by Wholesale of Household Goods (+7.6%), Wholesale of Food, Beverages & Tobacco (+7.7%), and Wholesale of Agricultural Raw Materials & Live Animals (+6.5%). Next, sales value for Motor Vehicles activities grew by 5.0 per cent to RM55.1 billion.
In the third quarter of 2024, the Food and Beverage sub-sector recorded a year-on-year revenue increase of 5.4 per cent, reaching RM18.9 billion. Concurrently, the Volume Index for this sub-sector grew by 4.3 per cent, achieving 134.0 points as compared to the same period in 2023. Meanwhile, the Accommodation sub-sector registered a 13.0 per cent growth in revenue, totalling RM4.2 billion, with the Volume Index increased by 12.4 per cent to 165.2 points.
Next, the revenue of the Information & Communication and Transport & Storage segment grew by 6.1 per cent, reaching RM85.5 billion compared to the same quarter in the previous year. This growth was driven by the Transportation & Storage sub-sector, which recorded an increase of 9.4 per cent in revenue. Meanwhile, the information & Communications sub-sector grew 3.2 per cent year-on-year. For Volume Index, this segment recorded an increase of 6.3 per cent, with Transportation & Storage and Information & Communication sub-sectors rose by 10.6 per cent and 3.5 per cent, respectively, as compared to the third quarter of 2023.
The Private Health, Private Education, Arts, Entertainment & Recreation, and Personal Services and Other Activities segment recorded a revenue of RM22.7 billion this quarter, reflecting a 12.2 per cent increase as compared to the same quarter of the previous year. This growth was primarily driven by the Private Health sub-sector, which posted an increase of 14.2 per cent in revenue. The Arts, Entertainment & Recreation sub-sector also recorded notable growth, with a significant 13.7 per cent year-on-year revenue increase. Next, the Private Education sub-sector’s revenue rose by 9.8 per cent, with the Volume Index increasing by 7.6 per cent to record 136.2 points.
Revenue for the Professional, Real Estate and Administrative & Support Service segment increased by 11.2 per cent compared to the same quarter of the previous year. This growth was propelled by the Administrative and Support Service and Professional sub-sectors, which grew by 10.4 per cent and 9.1 per cent, respectively.
The income of e-Commerce this quarter reached RM300.5 billion, reflecting a 3.8 per cent increase year-on-year compared to the same quarter last year. In comparison to the previous quarter, e-Commerce revenue recorded a slight decline of 0.6 per cent (Chart 17).
The total number of persons engaged in the Services sector for this quarter stood at 4.5 million persons, an increase of 1.7 per cent year-on-year. This growth was led by the Wholesale & Retail Trade, Food & Beverages and Accommodation segment, which saw an increase of 1.6 per cent to record 3.0 million persons, followed by the Information & Communication and Transportation & Storage segment up 3.1 per cent. On a quarter-on-quarter basis, the number of persons engaged grew by 0.6 per cent, adding 25.6 thousand persons. (Table 8).
In this quarter, the total salaries and wages in the Services sector increased by 3.8 per cent year-on-year, amounting to RM33.0 billion. This was attributed by Wholesale & Retail Trade, Food & Beverages and Accommodation and Information & Communication and Transportation & Storage segments which rose 3.3 per cent and 3.9 per cent, respectively (Table 9).
Looking ahead to the fourth quarter of 2024, the Services sector is likely to experience steady growth, driven by robust activities in tourism, digital transformation and consumer demand. Furthermore, the holiday season in the fourth quarter will stimulate domestic movement, which is anticipated to boost demand for goods and services related to tourism.
Export performance in Q3 2024 demonstrated positive momentum, primarily driven by the United States, which increased by RM11.7 billion, followed by Taiwan (+RM7.2 billion), Singapore (+RM5.1 billion), and the European Union (EU) (+RM2.3 billion). A similar trend was observed in imports, with significant increases from the USA (+RM17.9 billion), followed by China (+RM11.7 billion), Taiwan (+RM8.5 billion), and Singapore (+RM4.3 billion). Overall, Malaysia’s trade in Q3 2024 remained driven by China, Singapore, United States, and the EU, contributing a combined 50.1 per cent (Q3 2023: 48.7%).
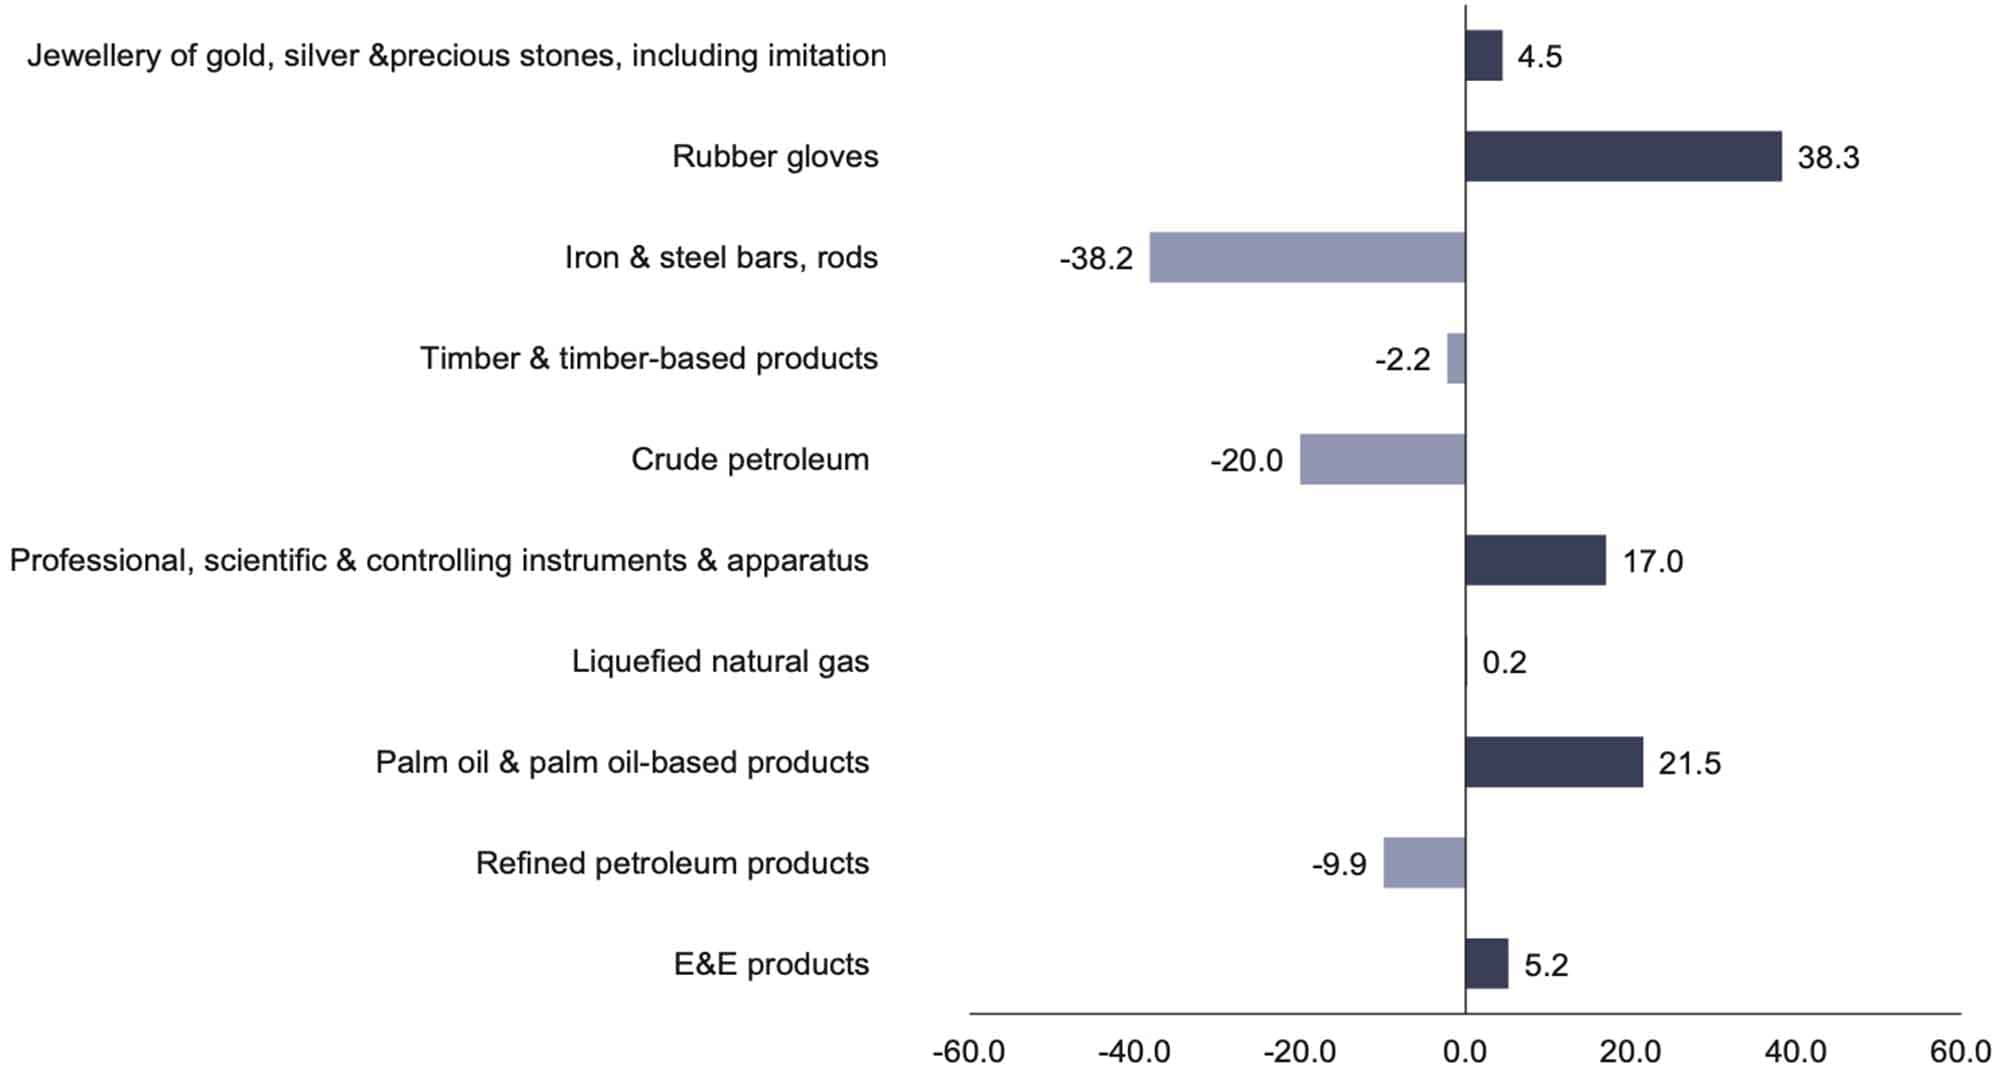
Malaysia’s export of merchandise performance remained stable with a positive growth, at a rate of 7.8 per cent year-on-year in Q3 2024, from RM356.3 billion in the same quarter of 2023 to RM384.1 billion. This encouraging achievement was mainly driven by the increase in exports of Electrical & electronic (E&E) products and Palm oil & palm oil-based products, up RM7.7 billion (+5.2%) and RM5.4 billion (+21.5%), respectively, for the second consecutive quarter as shown in Chart 18. In addition, Professional, scientific & controlling instruments & apparatus and Rubber gloves also contributed significantly to the double-digit positive growth, with an increase of RM2.2 billion (+17.0%) and RM1.2 billion (+38.3%), respectively. On the other hand, Crude petroleum and Timber & timber-based products turned around with declining trends, down RM1.5 billion (-20.0%) and RM126.0 million (-2.2%), respectively. E&E product turns arounds, Palm oil & palm oil-based products and Refined petroleum products were Malaysia’s main export products in Q3 2024, with an aggregate contribution of 55.7 per cent (Q3 2023: 57.2%).
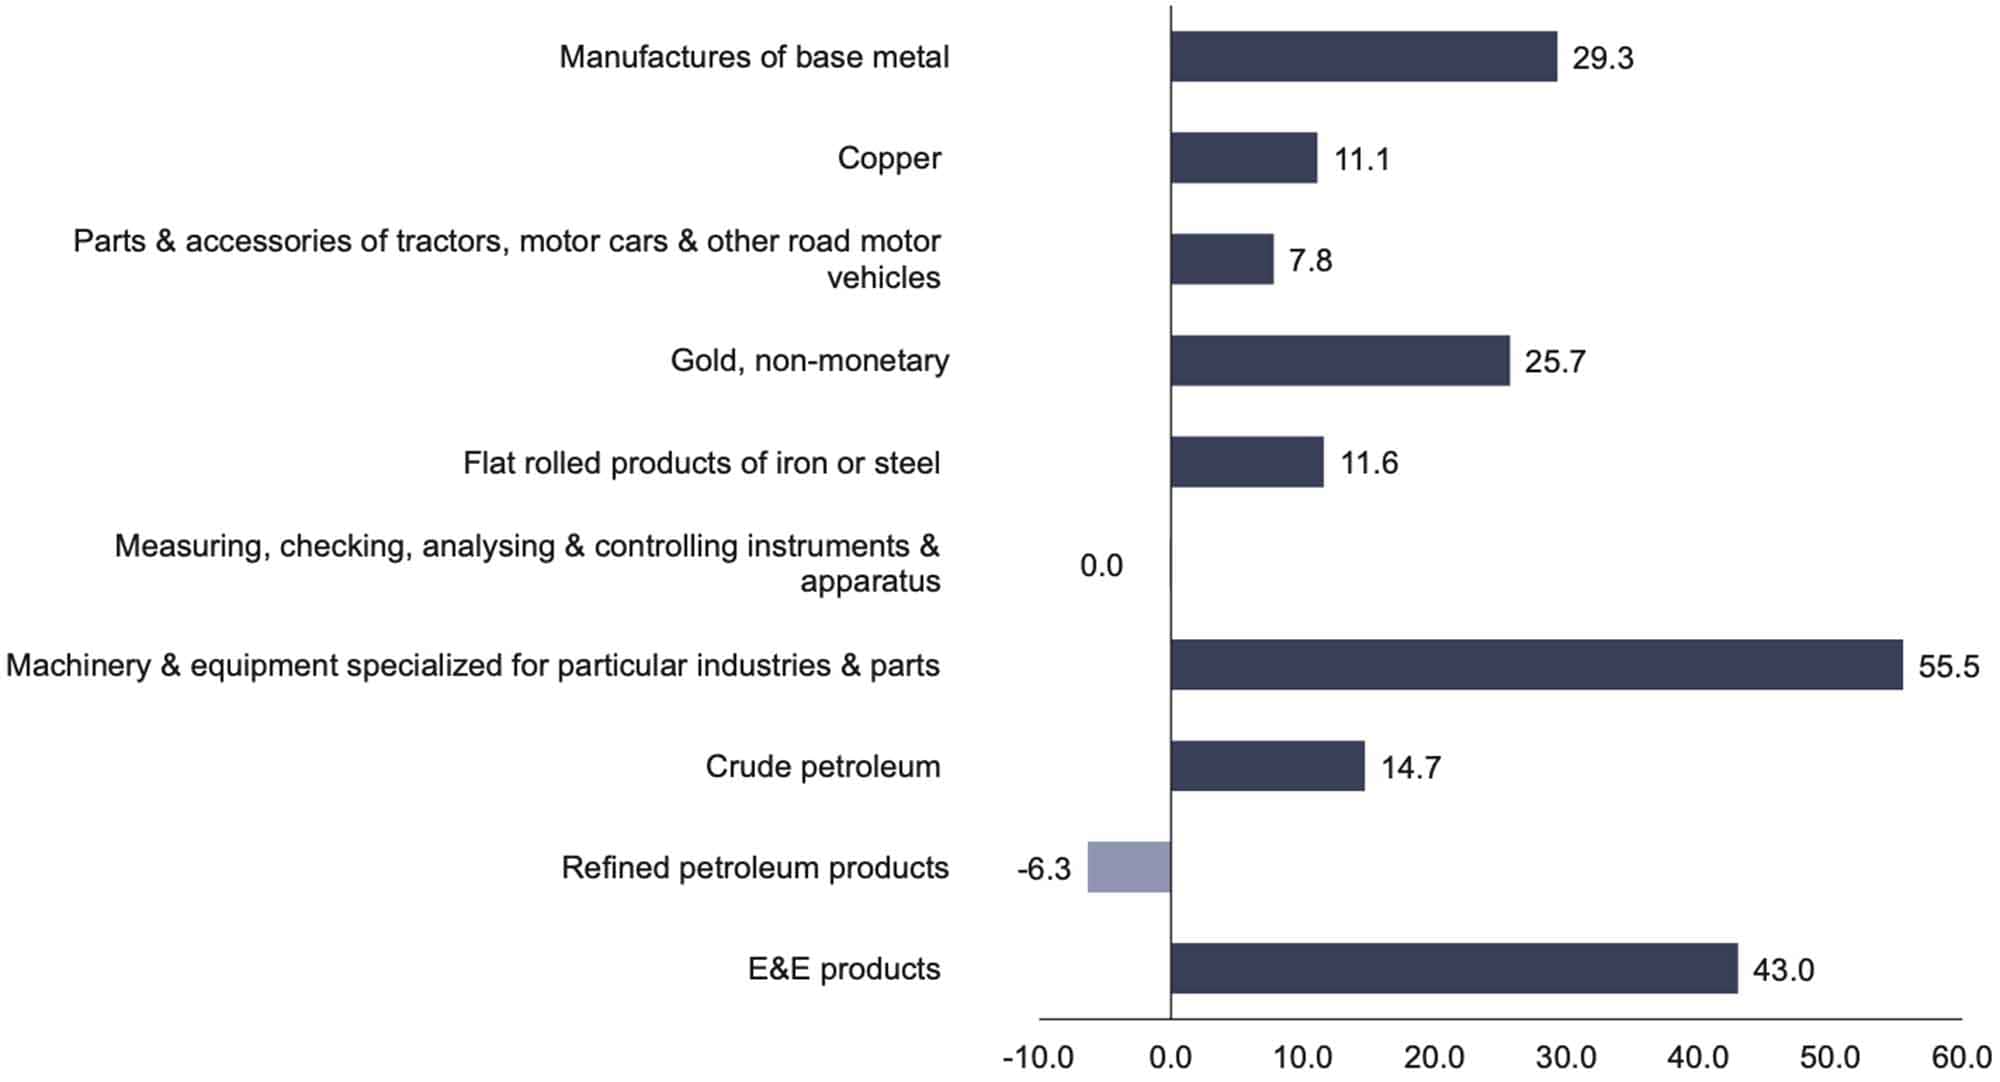
Similar to exports, imports also recorded an increase in Q3 2024, surpassing export performance with a year-on-year growth of 20.8 per cent, reaching RM359.0 billion compared to RM297.2 billion in Q3 2023. The main driver of import growth was E&E products, which surged by 43.0 per cent or RM127.3 billion since the beginning of the quarter. Meanwhile, Flat rolled products of iron or steel and Parts & accessories for tractors, motorcars, & road other motor vehicles showed signs of recovery, rising by RM464.7 million (+11.6%) and RM381.7 million (+7.8%), respectively (Chart 19). On the other hand, Refined petroleum products saw a decline (+RM1.9 billion, -6.3%) after two consecutive quarters of positive performance. Similarly, Measuring, checking, analysing & controlling instruments & apparatus experienced a shift from positive to negative growth, albeit at a very minimal rate (-RM1.5 million, -0.03%). E&E products, Refined petroleum products, and Crude petroleum remained the main contributors to Malaysia’s imports in Q3 2024, with a cumulative contribution of 47.4 per cent (Q3 2023: 44.4%).
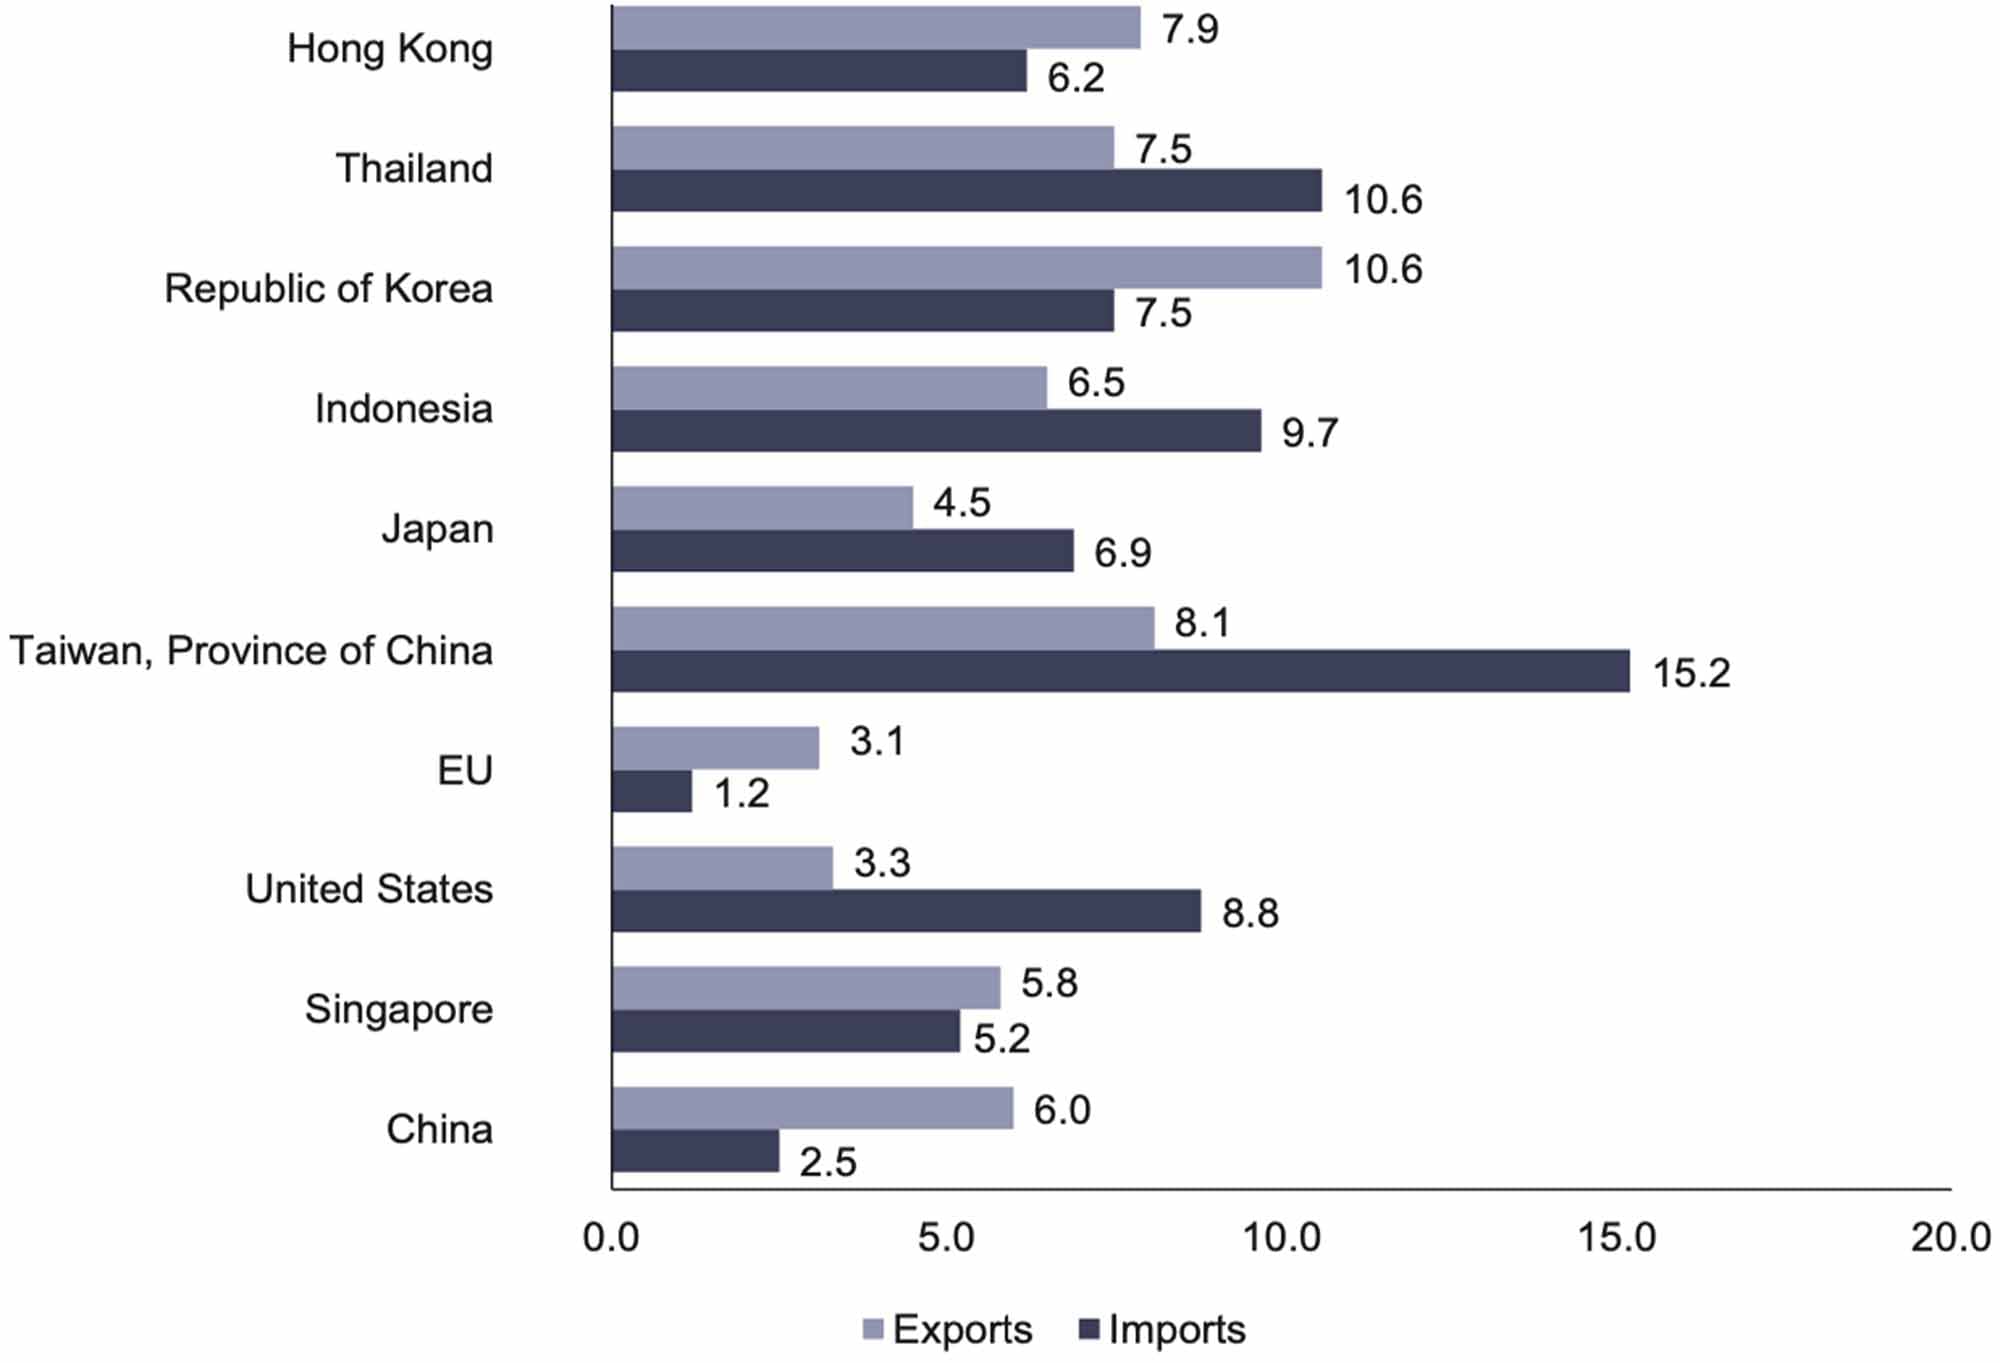
The global economic improvement has also influenced the trade performance of Malaysia’s key trading partners, which overall showed positive performance in Q3 2024, as illustrated in Chart 20.
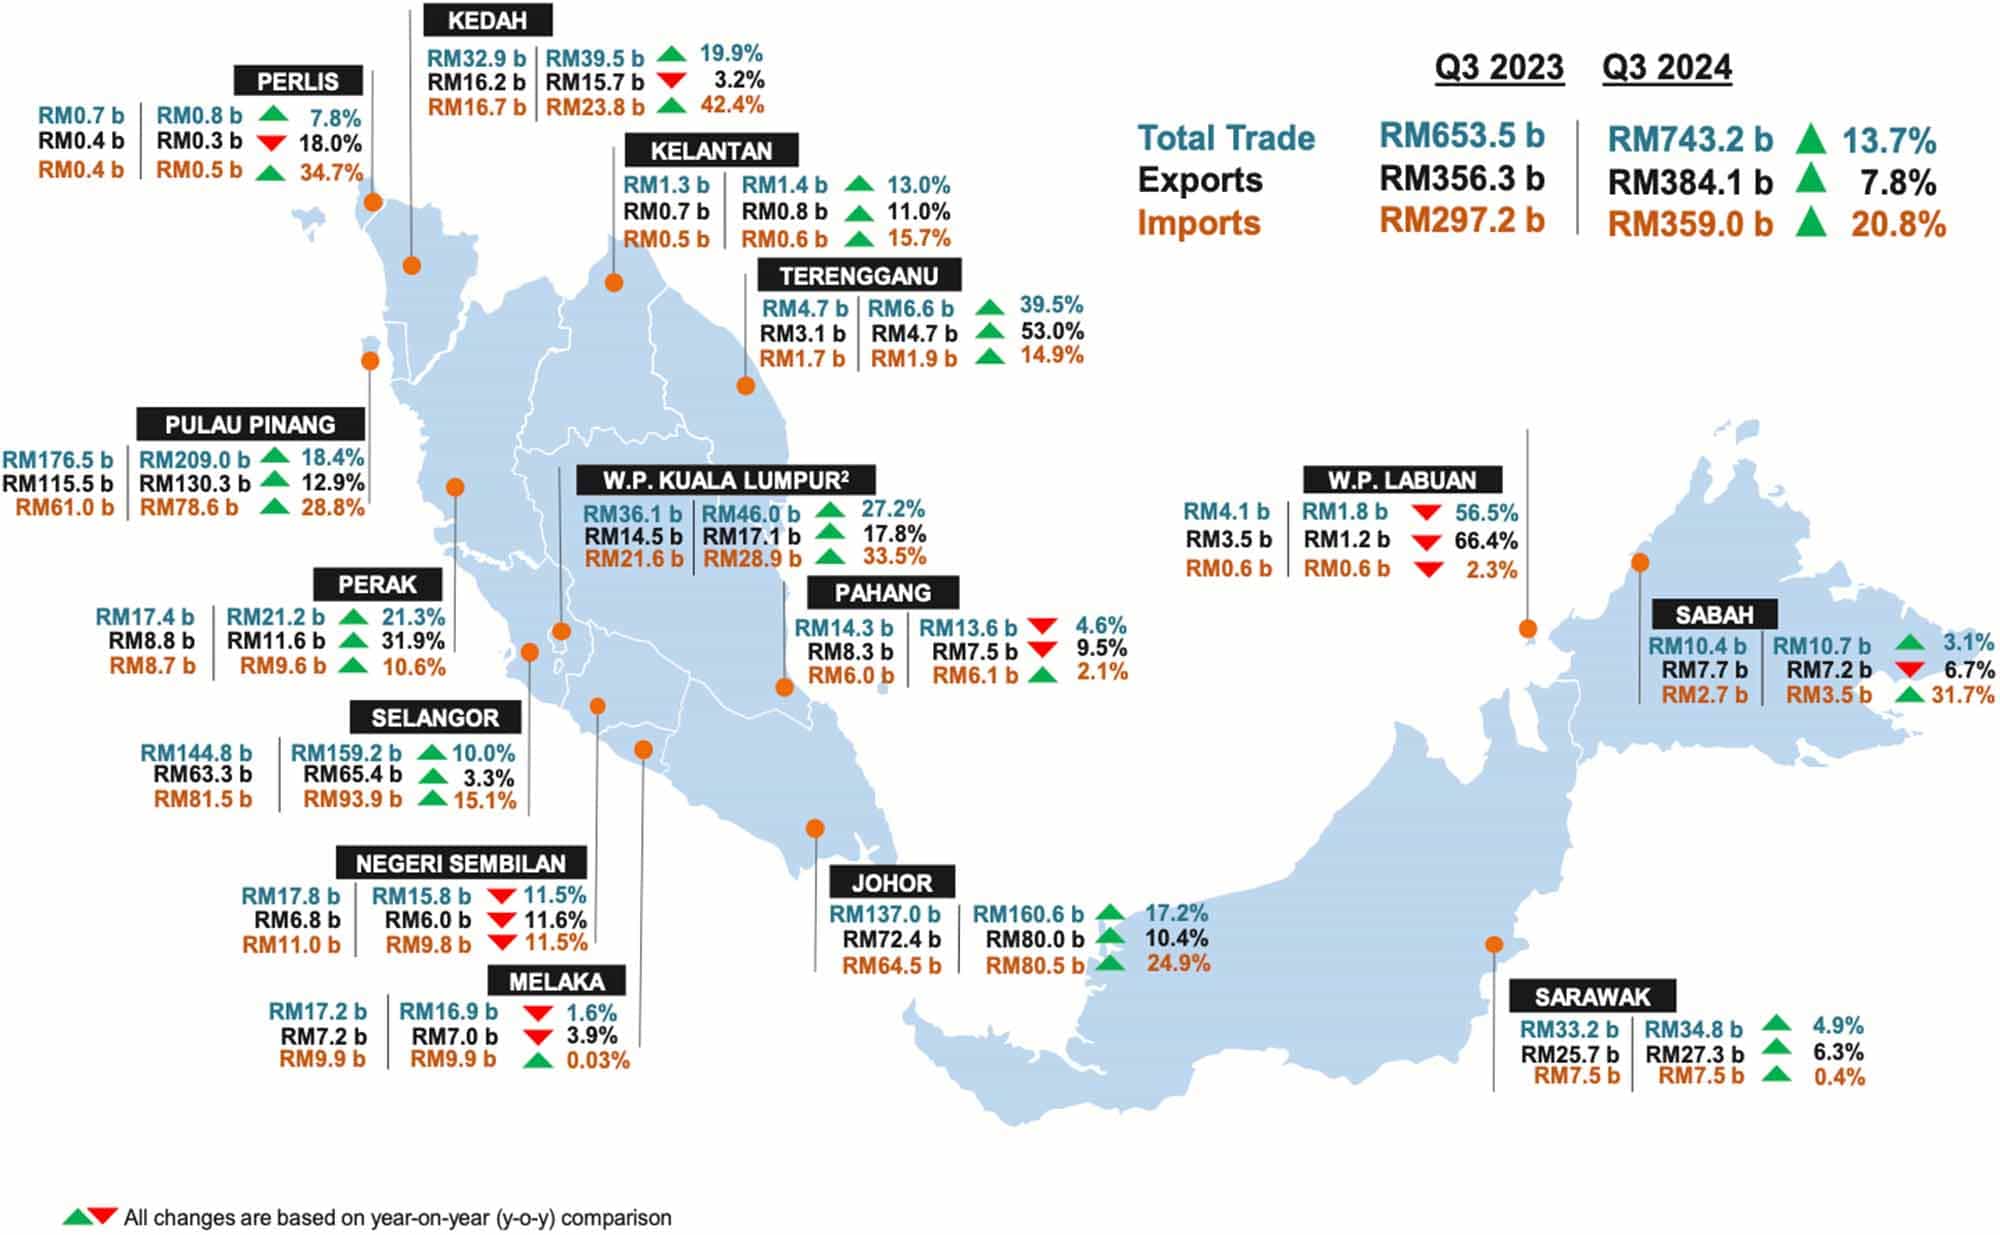
External trade statistics by state for the period of Q3 2024 showed that the total trade increased RM89.6 billion or 13.7 per cent to RM743.2 billion, year-on-year. The increase in total trade was attributed by most states mainly in Pulau Pinang which rise by RM32.5 billion (+18.4%) followed by Johor RM23.6 billion (+17.2%), Selangor RM14.4 billion (+10.0%), W.P. Kuala Lumpur RM9.8 billion (+27.2%), Kedah RM6.6 billion (+19.9%), Perak RM3.7 billion (+21.3%), Terengganu RM1.9 billion (+39.5%), Sarawak RM1.6 billion (+4.9%), Sabah RM318.2 million (+3.1%), Kelantan RM163.1 million (+13.0%) and Perlis RM56.3 million (+7.8%). However, total trade decreased in W.P. Labuan RM2.3 billion (-56.5%), Negeri Sembilan RM2.1 billion (-11.5%), Pahang RM659.6 million (-4.6%) and Melaka RM277.0 million (-1.6%) as shown in Exhibit 1.
Total exports increased RM27.9 billion or 7.8 per cent to RM384.1 billion compared to the same period last year. The increase in exports was attributed to the higher exports in most states such as Pulau Pinang (+RM14.9 billion), Johor (+RM7.6 billion), Perak (+RM2.8 billion),W.P. Kuala Lumpur (RM2.6 billion), Selangor (+RM2.1 billion), Terengganu (+RM1.6 billion), Sarawak (+RM1.6 billion) and Kelantan (+RM80.6 million). However, exports decreased in W.P. Labuan (-RM2.3 billion), Pahang (-RM786.1 million), Negeri Sembilan (-RM784.6 million), Sabah (-RM521.3 million), Kedah (-RM515.3 million), Melaka (-RM280.4 million) and Perlis (-RM65.8 million).
At the same time, imports also increased RM61.8 billion or 20.8 per cent to RM359.0 billion. The increase in imports was contributed by the higher imports in most states such as Pulau Pinang (+RM17.6 billion), Johor (+RM16.0 billion), Selangor (+RM12.3 billion), W.P. Kuala Lumpur (+RM7.2 billion), Kedah (+RM7.1 billion), Perak (+RM916.1 million), Sabah (RM839.5 million), Terengganu (+RM250.2 million), Pahang (+RM126.5 million), Perlis (+RM122.1 million), Kelantan (+RM82.5 million), Sarawak (+RM32.3 million) and Melaka (+RM3.4 million). However, imports decreased in Negeri Sembilan (-RM1.3 billion) and W.P. Labuan (-RM14.8 million).
Five states remained dominating the country’s exports, accounting for 83.3 per cent of total exports. Pulau Pinang remained as the top exporter with a share of 33.9 per cent, followed by Johor (20.8%), Selangor (17.0%), Sarawak (7.1%) and W.P. Kuala Lumpur (4.4%). Meanwhile, as for imports, Selangor became the largest contributor with a share of 26.1 per cent, followed by Johor (22.4%), Pulau Pinang (21.9%), W.P. Kuala Lumpur (8.0%) and Kedah (6.6%).
Notes:
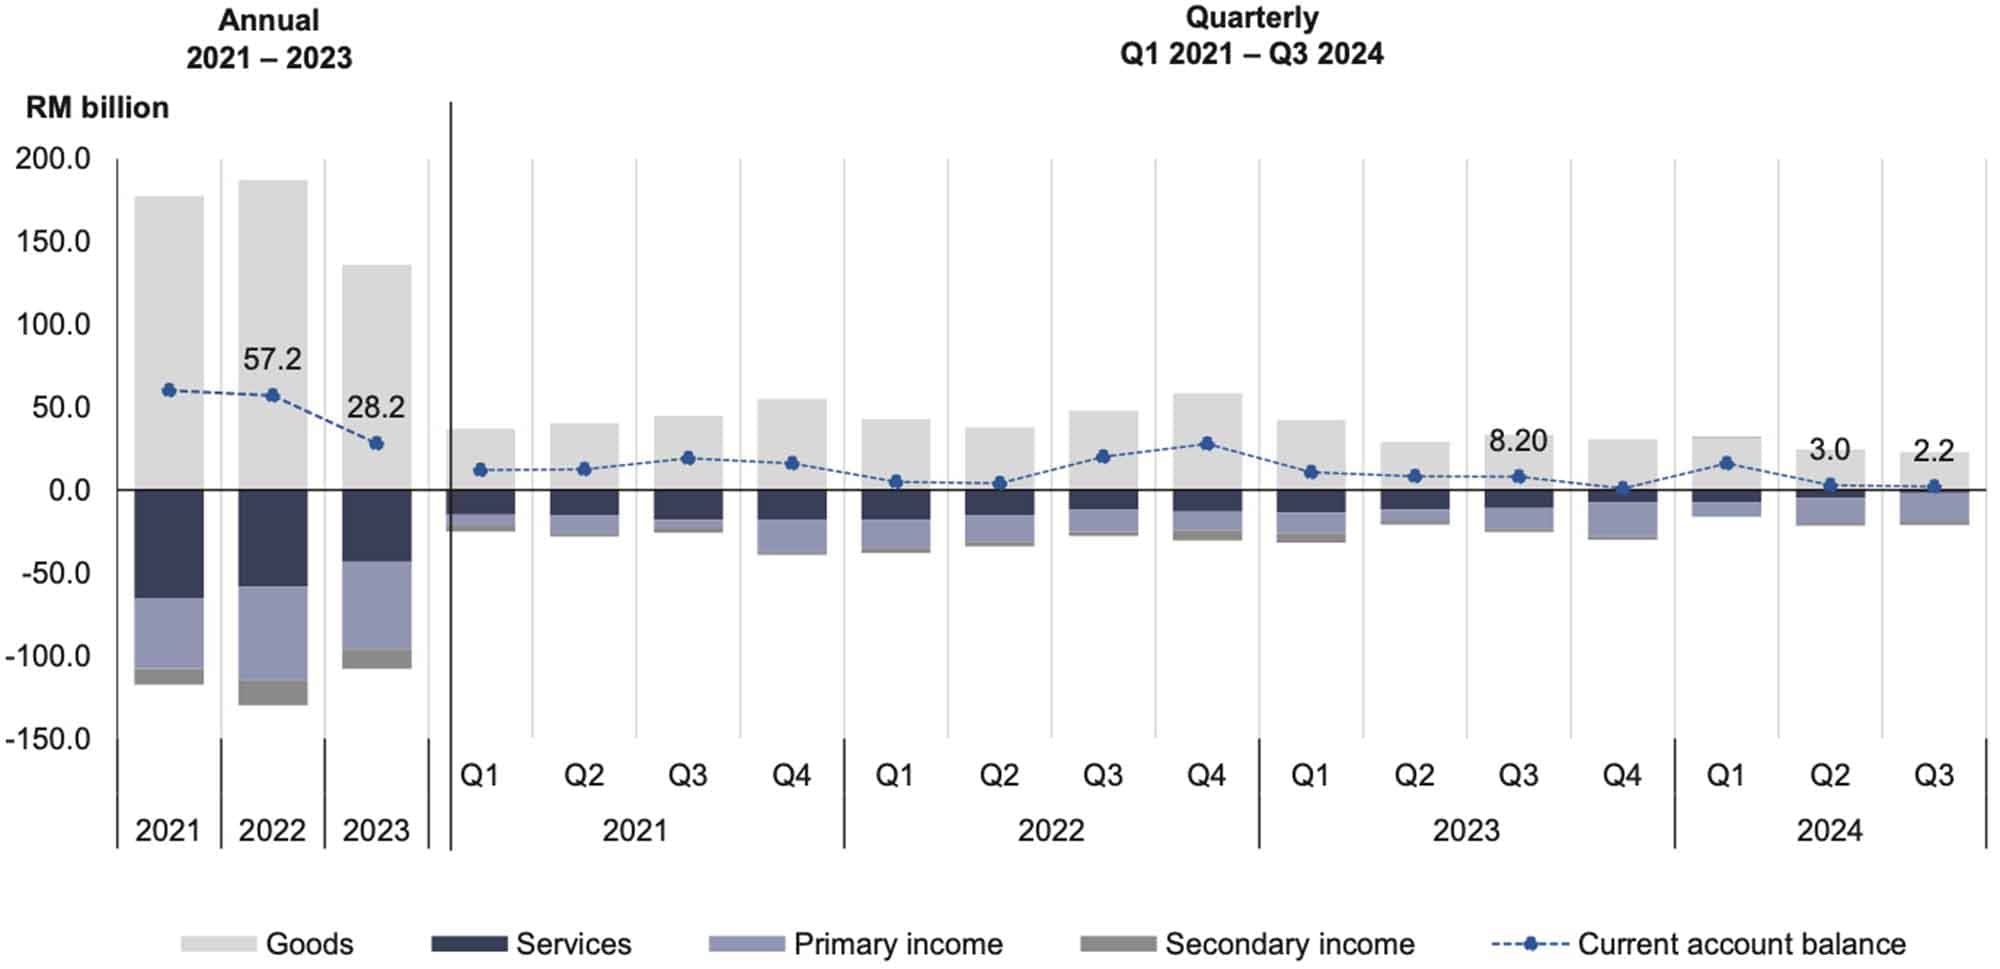
Malaysia’s Current Account Balance (CAB) recorded a surplus of RM2.2 billion in the third quarter of 2024 (Q3 2024), compared to RM8.2 billion in the same quarter of the previous year. This surplus was primarily supported by net exports in the Goods account (Chart 1).
The Goods account recorded net exports of RM23.1 billion in the third quarter of 2024 compared to RM33.6 billion in the same quarter of 2023. Exports of goods increased to RM289.6 billion in the third quarter of 2024 (Q3 2023: RM261.3 billion). The main exports were Electrical & electronics (E&E), Petroleum products and Palm oil & palm oil-based products, specifically to Singapore, the United StatesUSA and China. Imports of goods also increased to RM266.4 billion in the third quarter of 2024 (Q3 2023: RM227.7 billion). These imports were mainly driven by Intermediate goods, particularly parts and accessories of capital goods (excluding transport equipment) as well as Capital goods. The top sources for imports were China, Singapore, and the United States.
The Services account registered a lower deficit of RM1.6 billion in the third quarter of 2024 compared tot RM10.5 billion over the corresponding quarter of the preceding year. The improvement was driven by a higher surplus in Travel and a lower deficit in Other business services.
Exports of services were valued at RM63.9 billion, while imports of services amounted to RM65.4 billion in the third quarter of 2024. Travel recorded the highest export value, amounting to RM25.7 billion. The second highest export was Other business services (RM10.8 billion) followed by Transport (RM9.4 billion). Meanwhile, the largest contributors to service imports were Transport (RM16.9 billion), Travel (RM14.7 billion), and Other business services (RM13.7 billion).
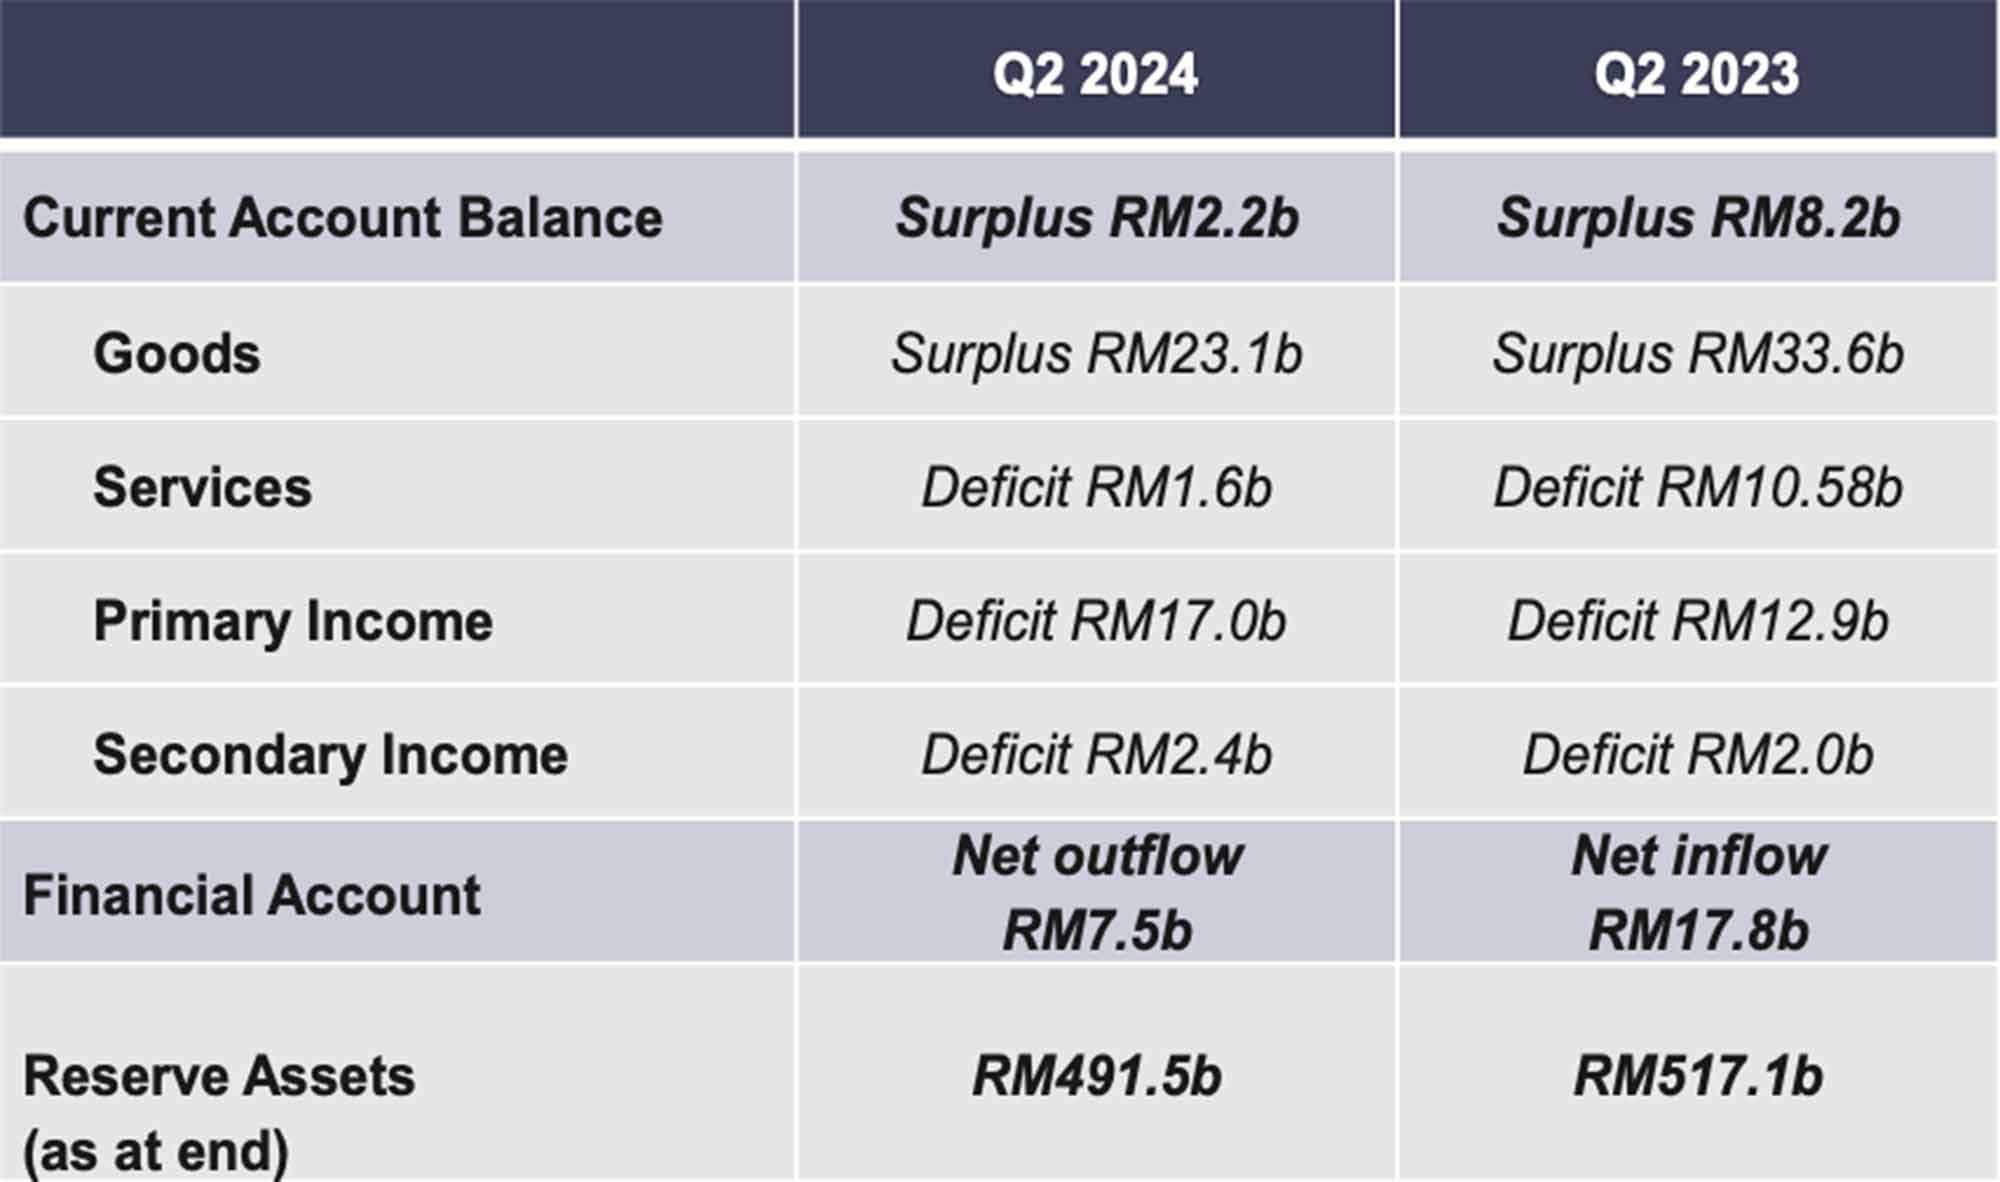
The Primary Income account registered a higher deficit of RM17.0 billion in the third quarter of 2024 as compared to RM12.9 billion (Q3 2023) (Table 10). This was due to higher earnings by foreign companies in Malaysia.
Meanwhile, the Secondary Income account registered a higher deficit of RM2.4 billion for the third quarter of 2024 compared to RM2.0 billion in the same quarter of the previous year. This was due to higher payments in personal grants and gifts, along with an increase in workers’ remittances to other countries.
In regards to investment, Direct investment recorded a higher net outflow of RM4.3 billion in this quarter compared to RM3.1 billion in the corresponding quarter of the previous year.
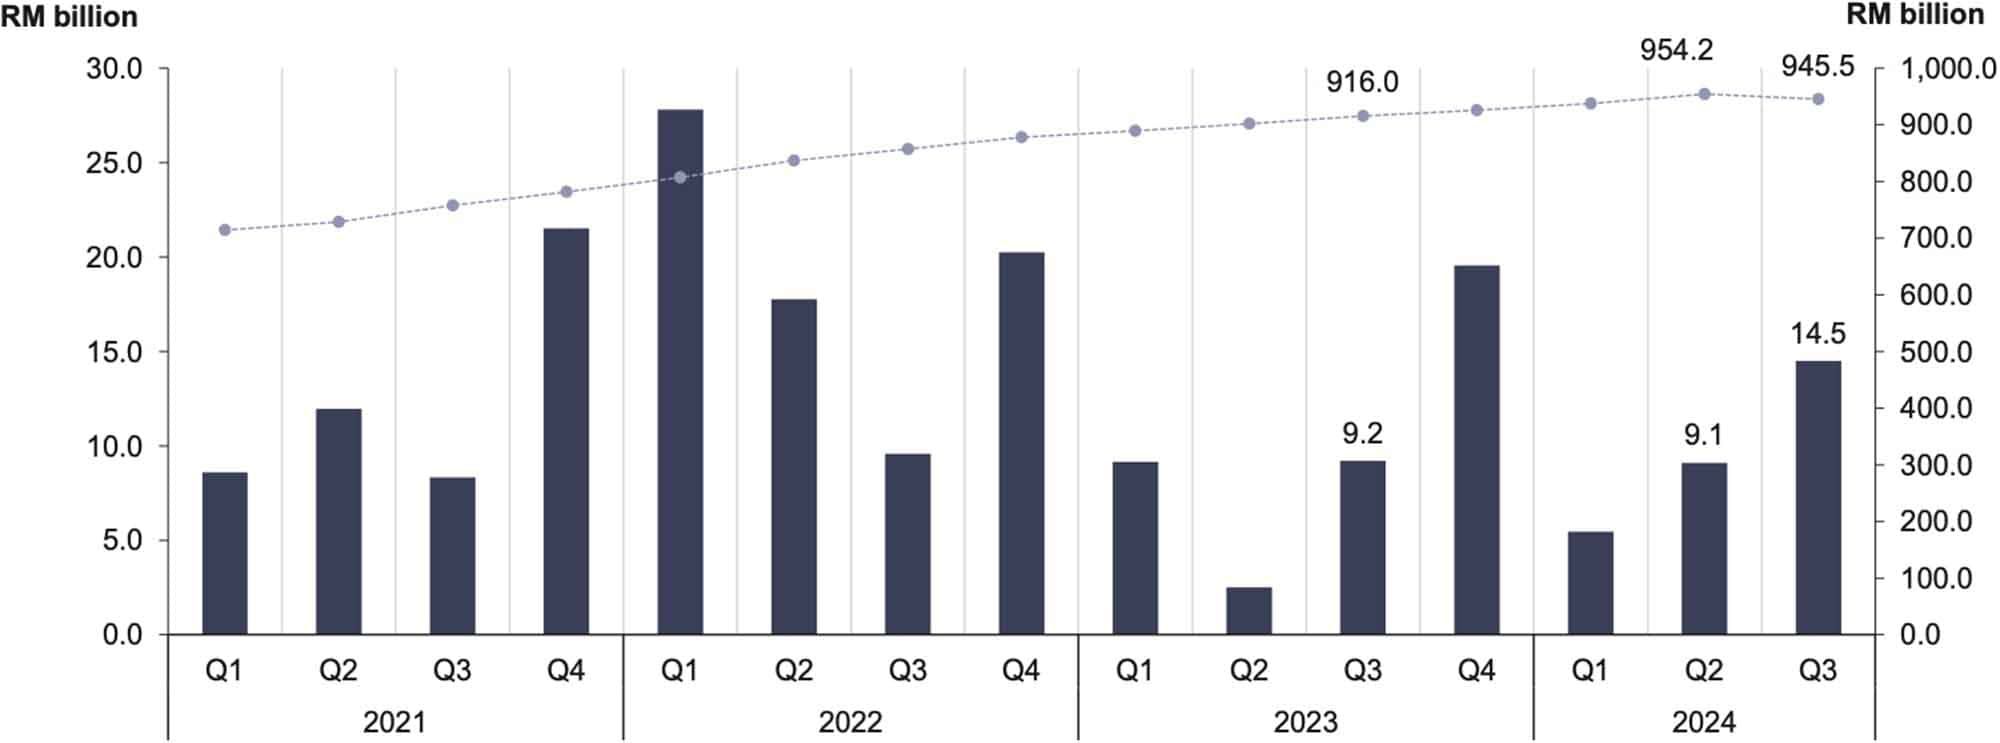
From July to September 2024, Foreign Direct Investment (FDI) registered a higher inflow of RM14.5 billion as compared to RM9.2 billion during the same period in the previous year. This increase was primarily driven by higher inflows into Equity & investment fund shares (Chart 22). Services sector, predominantly the Information & communication subsector, registered the largest portion of FDI flows during this quarter, followed by the Construction sector. The main sources of FDI were Singapore, Hong Kong, and Switzerland.
As of the end of the third quarter of 2024, the cumulative investment of FDI stood at RM945.5 billion compared to RM916.0 billion in the same quarter of 2023. The Services sector remained the largest recipient with a total value of RM496.3 billion, followed by Manufacturing (RM383.1 billion) and Mining & quarrying (RM40.8 billion). In terms of FDI position, Asia was the leading region, driven largely by investments from Singapore and Hong Kong.
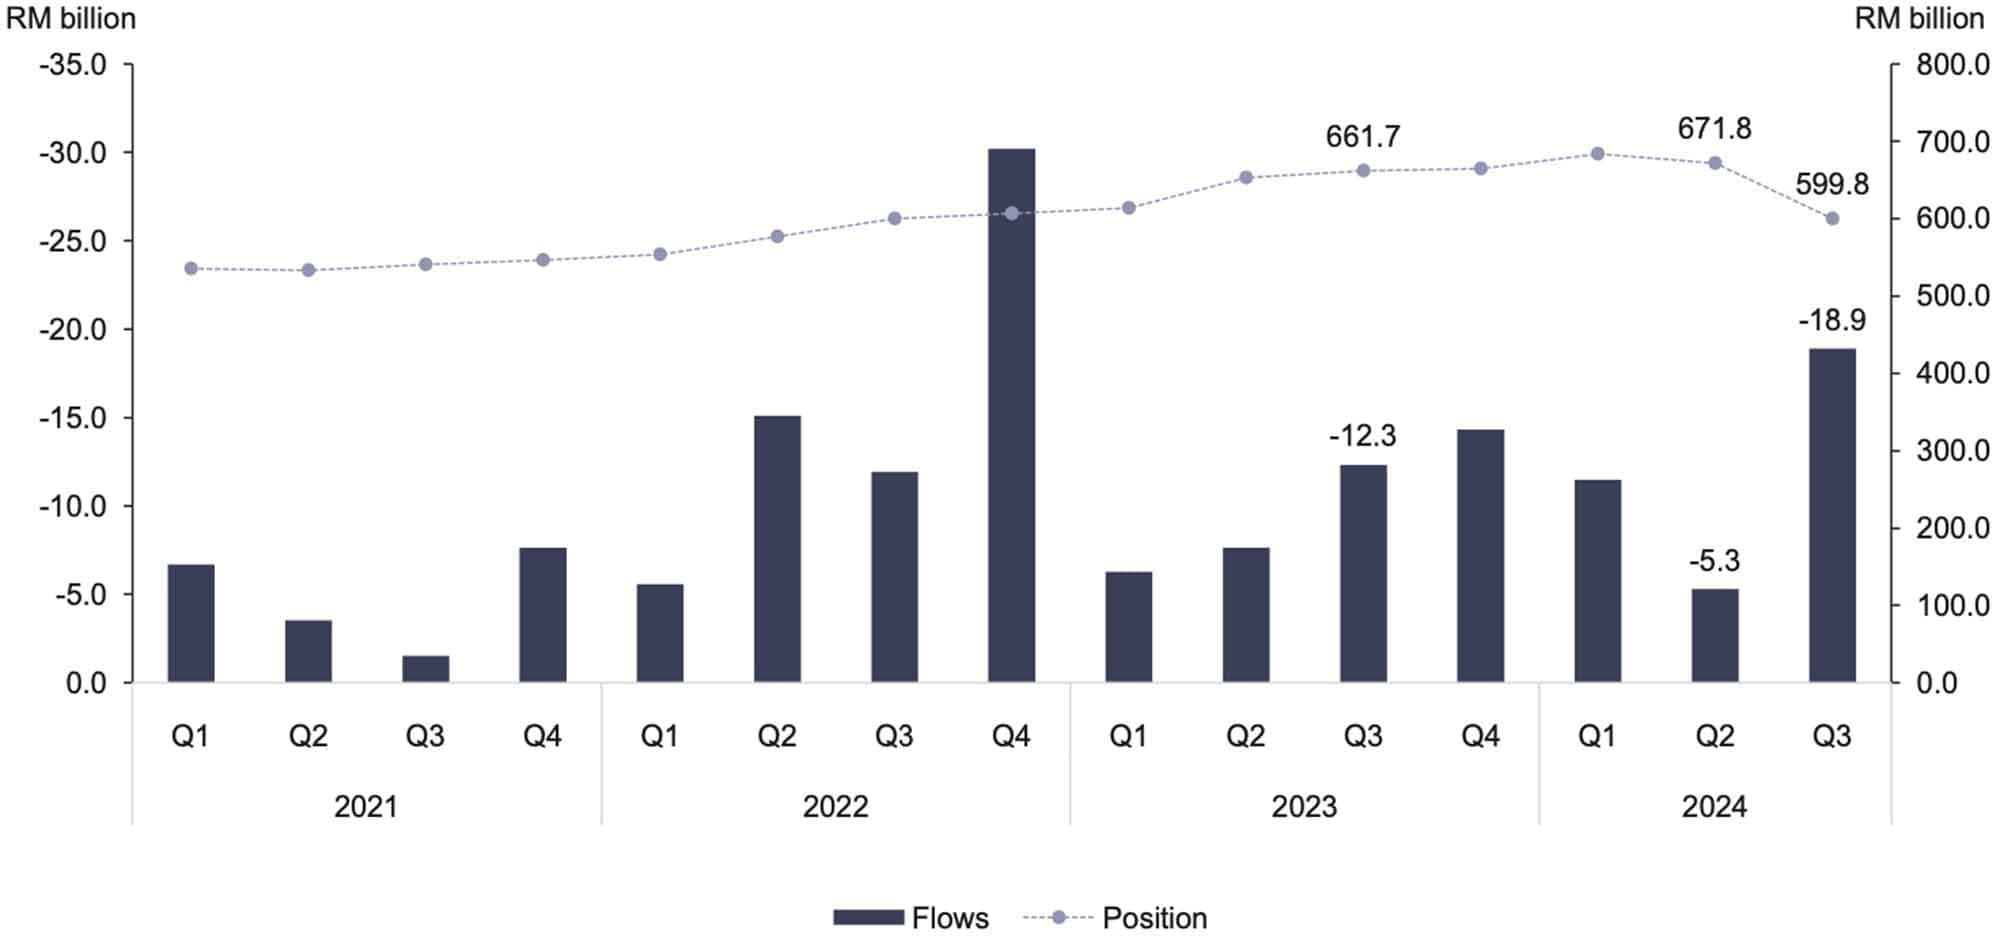
Meanwhile, Direct Investment Abroad (DIA) by Malaysian investors recorded a higher net outflow of RM18.9 billion in the third quarter of 2024 as against RM12.3 billion in the same period of the previous year (Chart 23). The main contributors to these outflows were Manufacturing sector, followed by Services sector, primarily in Financial activities sub-sector, and Mining & quarrying sector. The primary destinations for DIA were Saudi Arabia, Indonesia, and Canada.Malaysia’s DIA position decreased to RM599.8 billion as compared to RM661.7 billion in the third quarter of 2023.
The Services sector was the main contributor to the DIA position, followed by Mining & quarrying and Agriculture. The major sources for DIA position were Singapore, Indonesia and the Cayman Islands.
As of the end of the third quarter of 2024, Malaysia’s International Investment Position (IIP) registered net liabilities of RM38.6 billion from net assets of RM81.0 billion in the previous quarter. The total financial assets position was valued at RM2.33 trillion, while total liabilities amounted to RM2.37 trillion. Additionally, Malaysia’s International Reserves stood at RM491.5 billion at the end of the quarter.
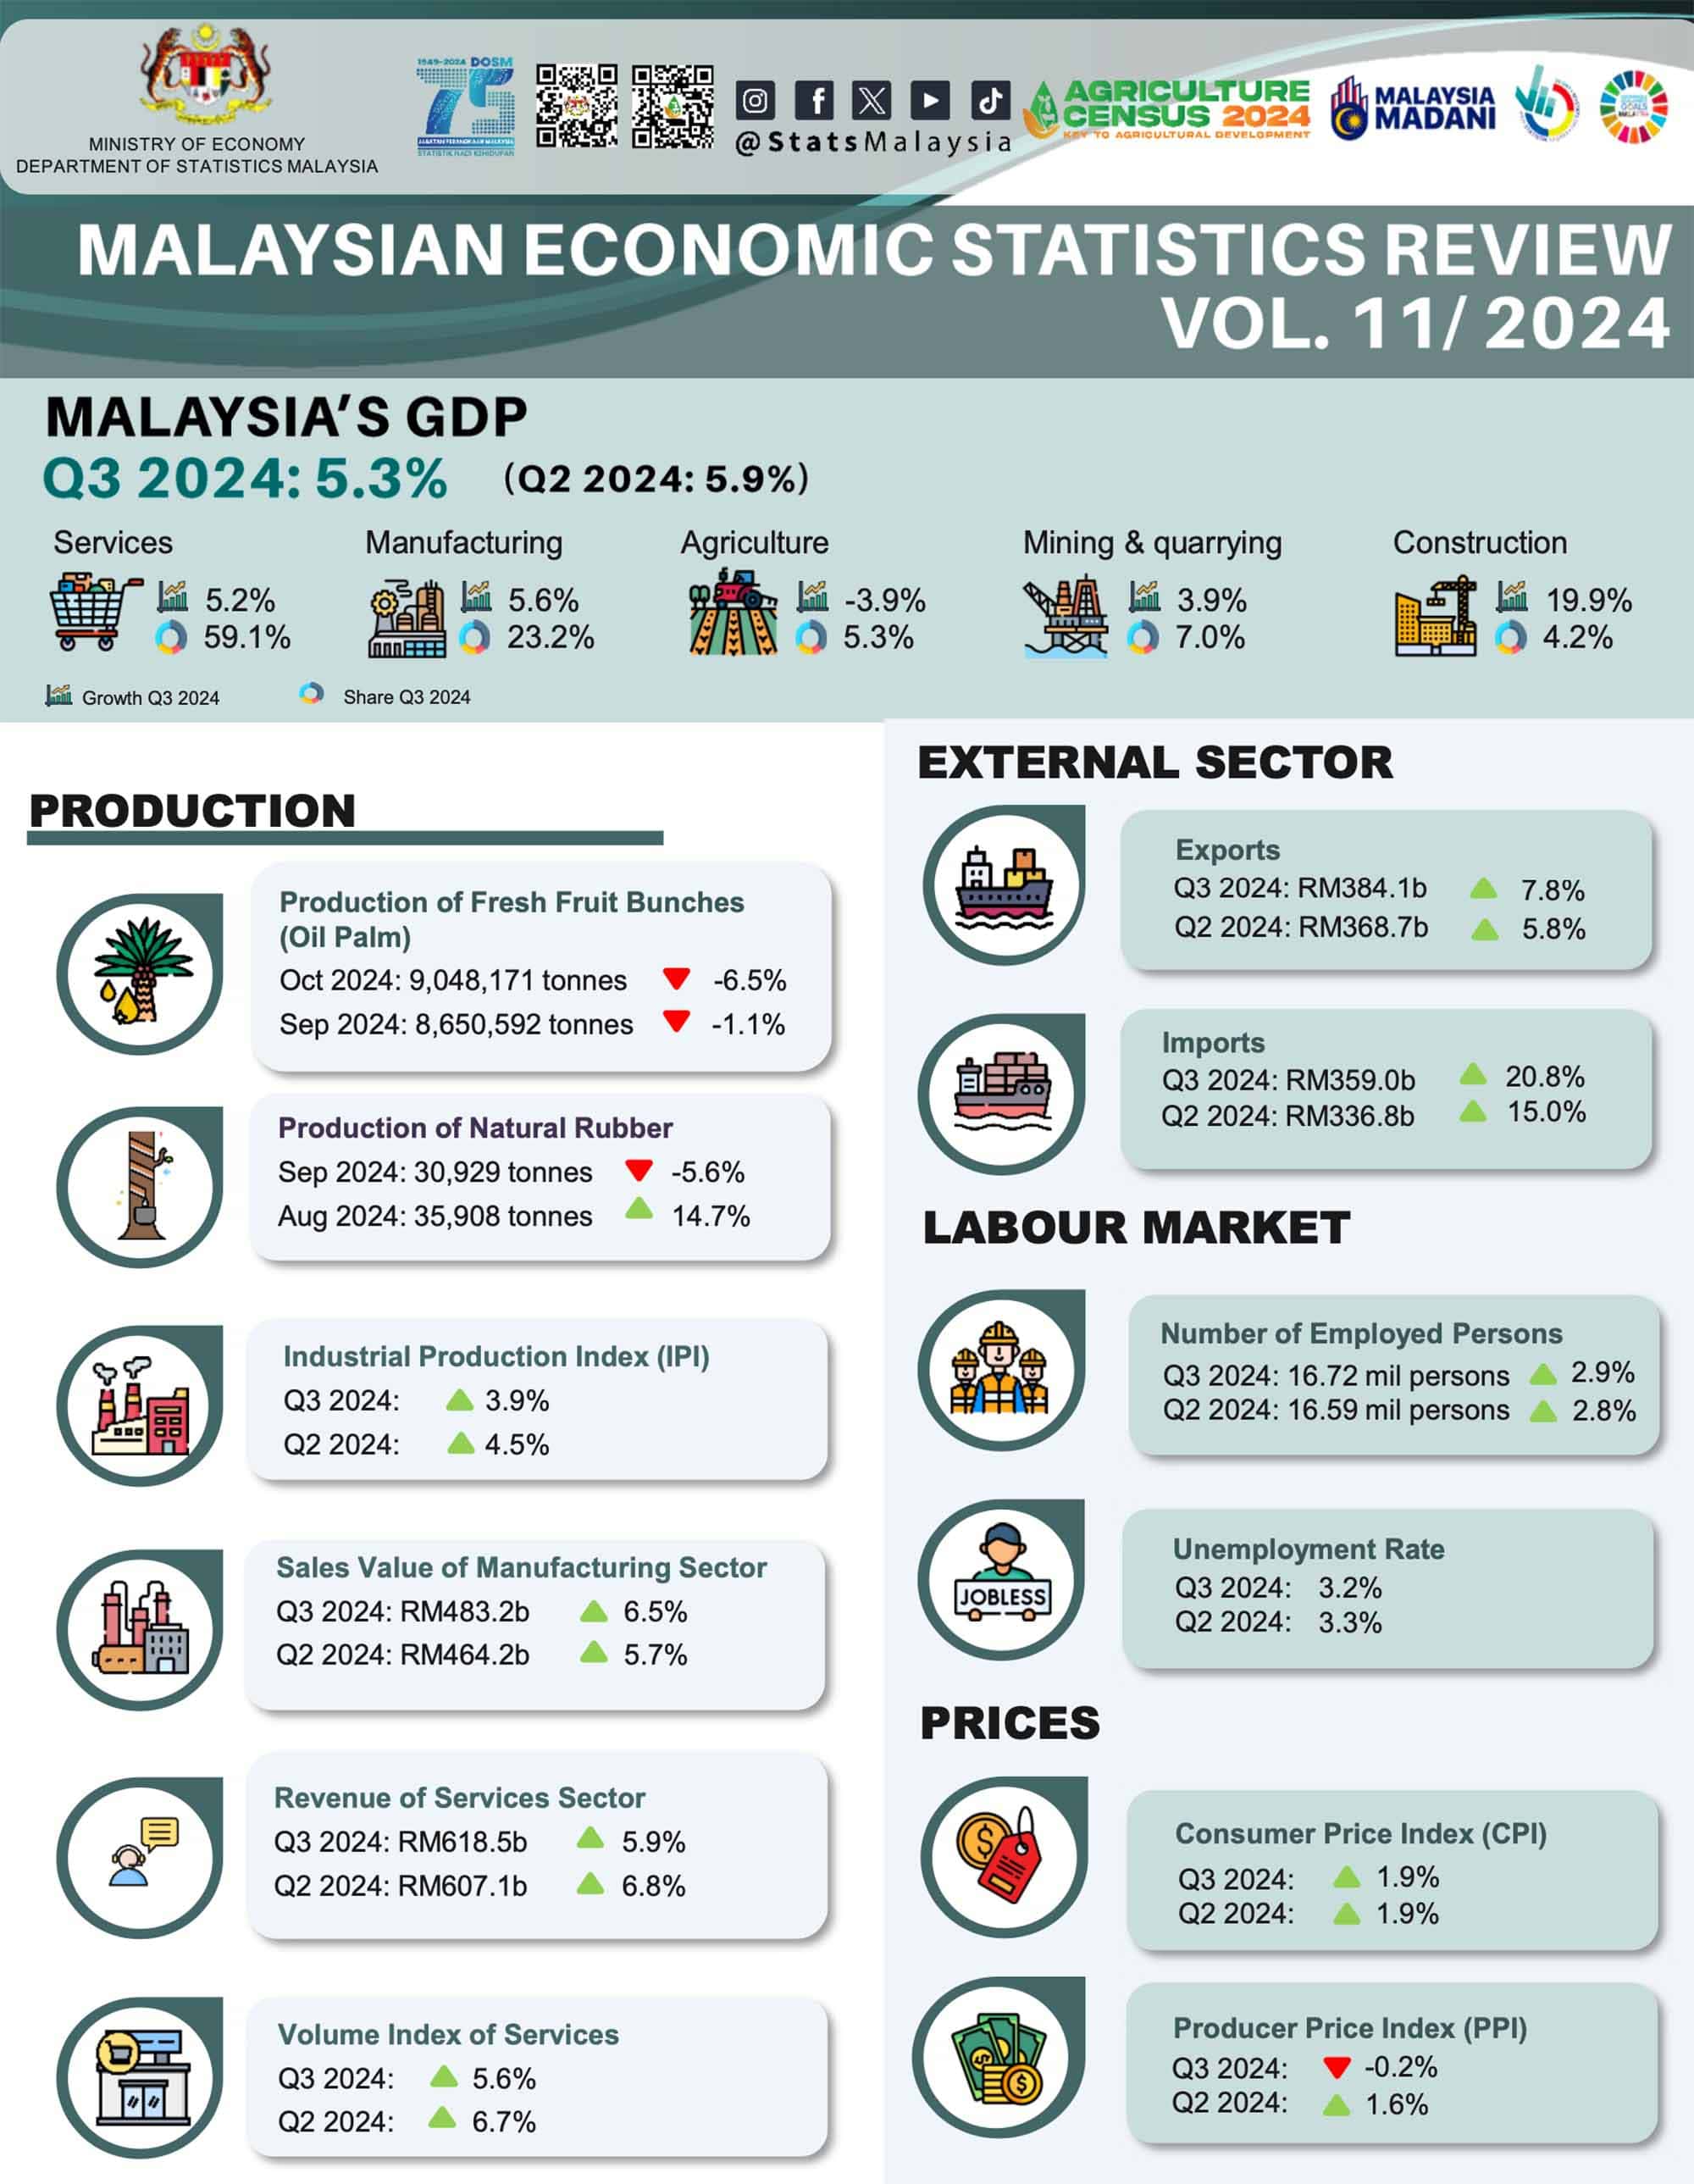
Malaysia's economic growth remains on track to reach 4.0 to 5.0 per cent in 2024, supported by strong domestic demand and an improving export sector, as indicated in Bank Negara Malaysia’s (BNM) recent reports. During Q3 2024, Gross Domestic Product (GDP) grew by 5.3 per cent, with supply-side performance mainly driven by the services, manufacturing, and construction sectors. On the demand side, private final consumption expenditure remained as the primary driver, followed by expenditure in gross fixed capital formation. This trajectory aligns with BNM's growth target for the year, although vulnerabilities persist due to potential external shocks and global inflation uncertainties.
In the third quarter of 2024, the Malaysian government prioritized Micro, Small, and Medium Enterprises (MSME) to strengthen the economy and enhance the labour force by allocating a budget for programmes that promote business and entrepreneurship. This initiative led to increased participation in MSME, which in turn strengthened the labour market. Additionally, the growing demand for Malaysian products boosted exports and attracted investments, particularly in the semiconductor manufacturing sector. Moreover, the government promoted tourism-related activities, particularly in agriculture. This initiative expanded the tourism sector, thus generated more job opportunities in the services sector, and encouraged greater labour market participation, thereby strengthening the labour force amid a positive economic outlook.
These factors have contributed to a stable labour market throughout the quarter, keeping the unemployment rate at 3.2 per cent, which is returning to pre-pandemic levels in 2019. This indicated consistent improvement driven by a growing labour force. Meanwhile, the continuous demand for labour led to a 1.2 per cent year-on-year increase in employment, equivalent to 109.2 thousand jobs. Consequently, the labour supply remained abundant as the labour force participation rate increased to 70.5 per cent in the third quarter of 2024. From the perspective of labour demand, the positive momentum in the economic sector continued this quarter with the total number of jobs increasing to 9,012 thousand, representing a year-on-year growth of 1.2 per cent compared to Q3 2023 (8,903 thousand jobs). This quarter saw a notable of 31.8 thousand newly added jobs, increasing opportunities for those seeking to enter the labour market in Q4 2024.
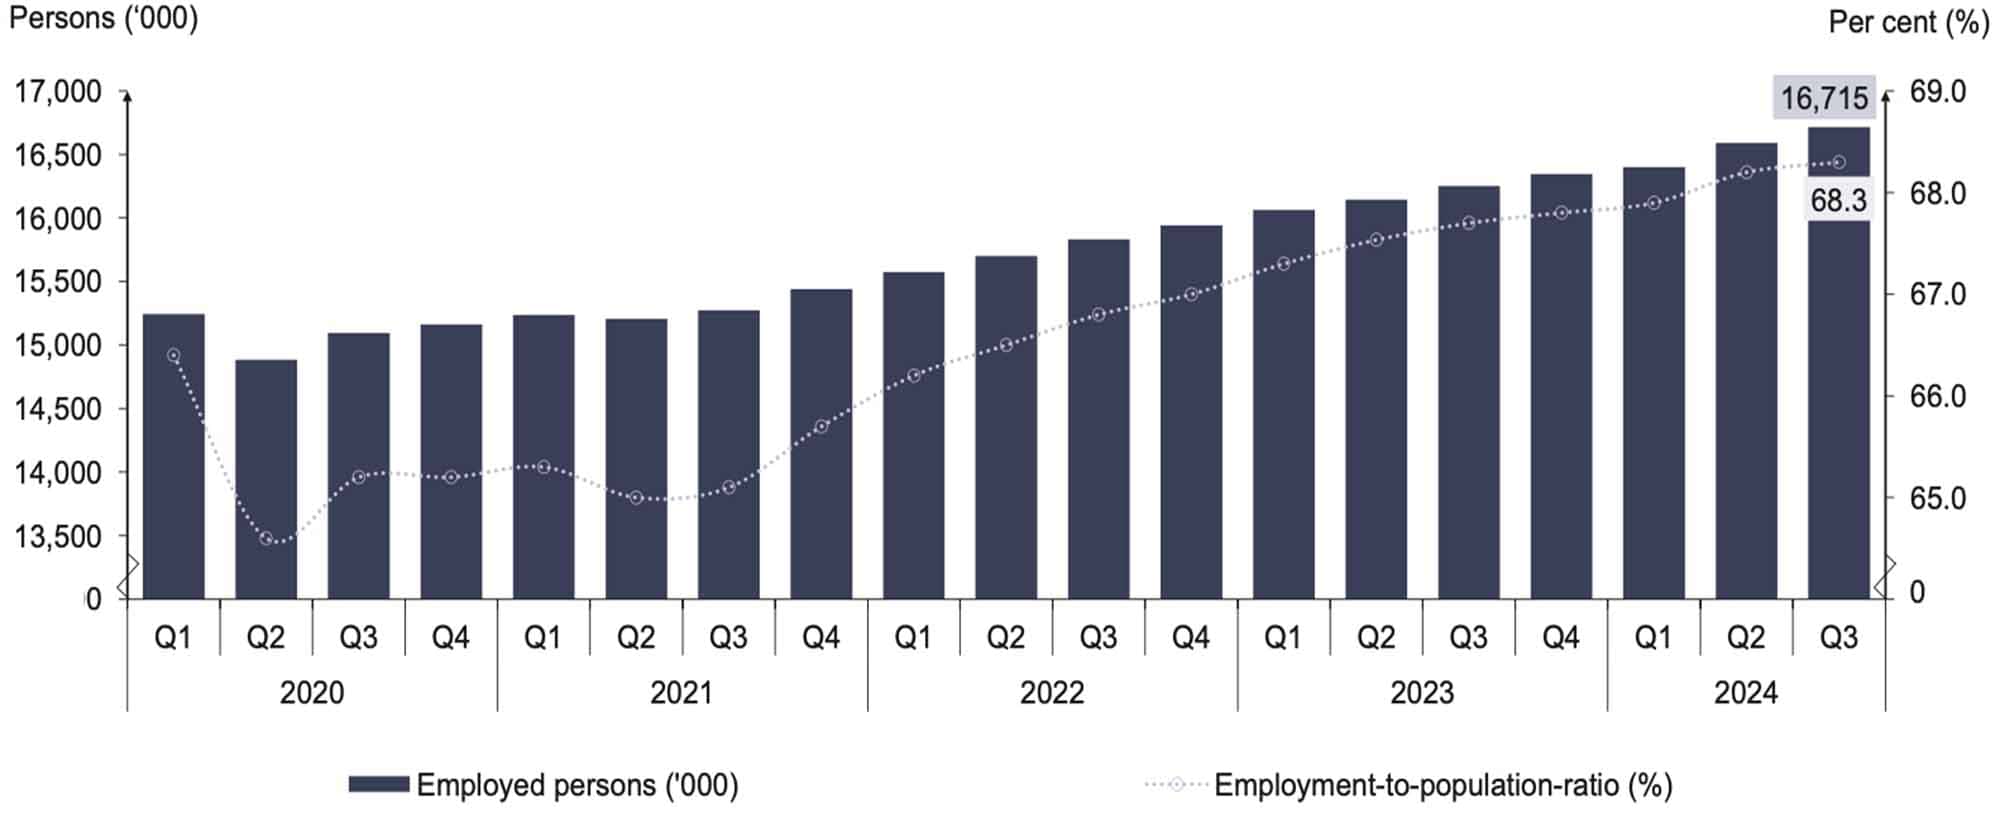
In the third quarter of 2024, the number of employed persons increased significantly by 2.9 per cent (+464.6 thousand) compared to 2.8 per cent in the previous quarter to record 16.72 million persons. Consequently, the ability of the economy to create employment as measured by the employment-to-population ratio increased by 0.6 percentage points from the same quarter of the preceding year to 68.3 per cent. In the meantime, employed persons also registered a moderate quarter-on-quarter growth of 0.7 per cent (+124.3 thousand), compared to 1.2 per cent in Q2 2024. During the same period, the employment-to-population ratio posted a rise of 0.1 percentage points (Chart 24).
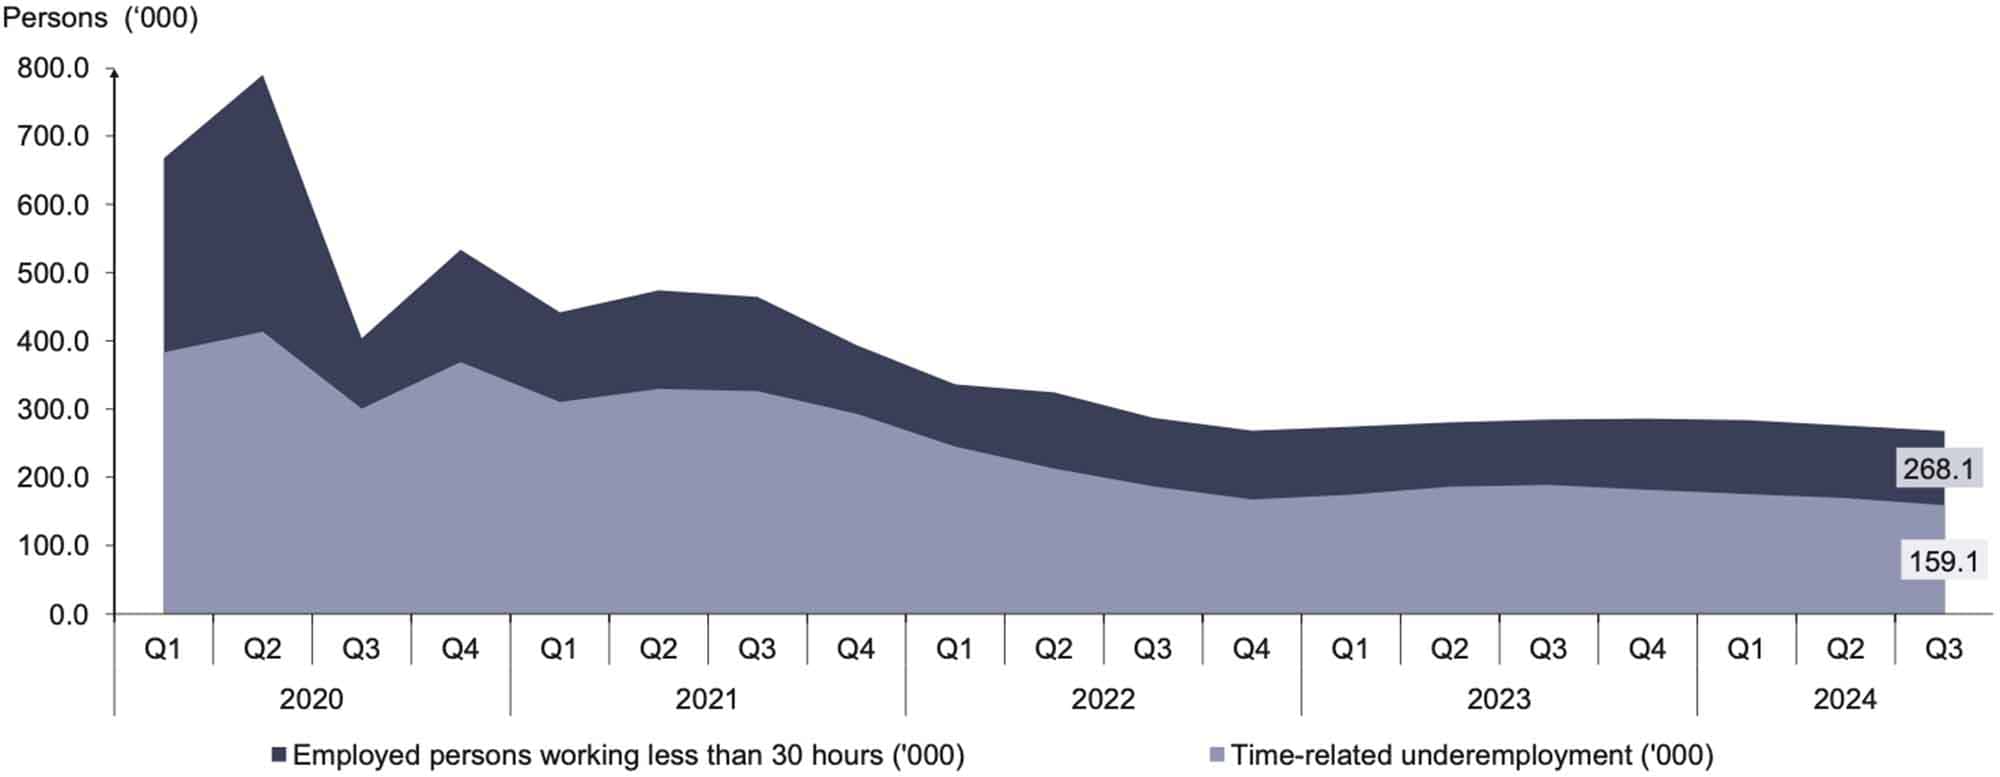
Compared to the same quarter last year, the number of employed persons who worked less than 30 hours per week decreased by 2.8 per cent to 268.1 thousand persons (Q2 2024: 275.8 thousand persons). Hence, the percentage share of those who worked less than 30 hours per week to the total employed encompassed 1.6 per cent for the third quarter of 2024.
In addition, the number of persons in time-related underemployment or those who were employed less than 30 hours per week and were able and willing to work additional hours posted a decline of 15.8 per cent (-29.8 thousand) compared to the same quarter of the previous year, reaching 159.1 thousand persons. In line with this, the rate of time-related underemployment descended by 0.2 percentage points year-on-year to 1.0 per cent. On a quarterly basis, this group decreased by 6.3 per cent (-10.6 thousand) while the rate remained steady at 1.0 per cent (Chart 25).
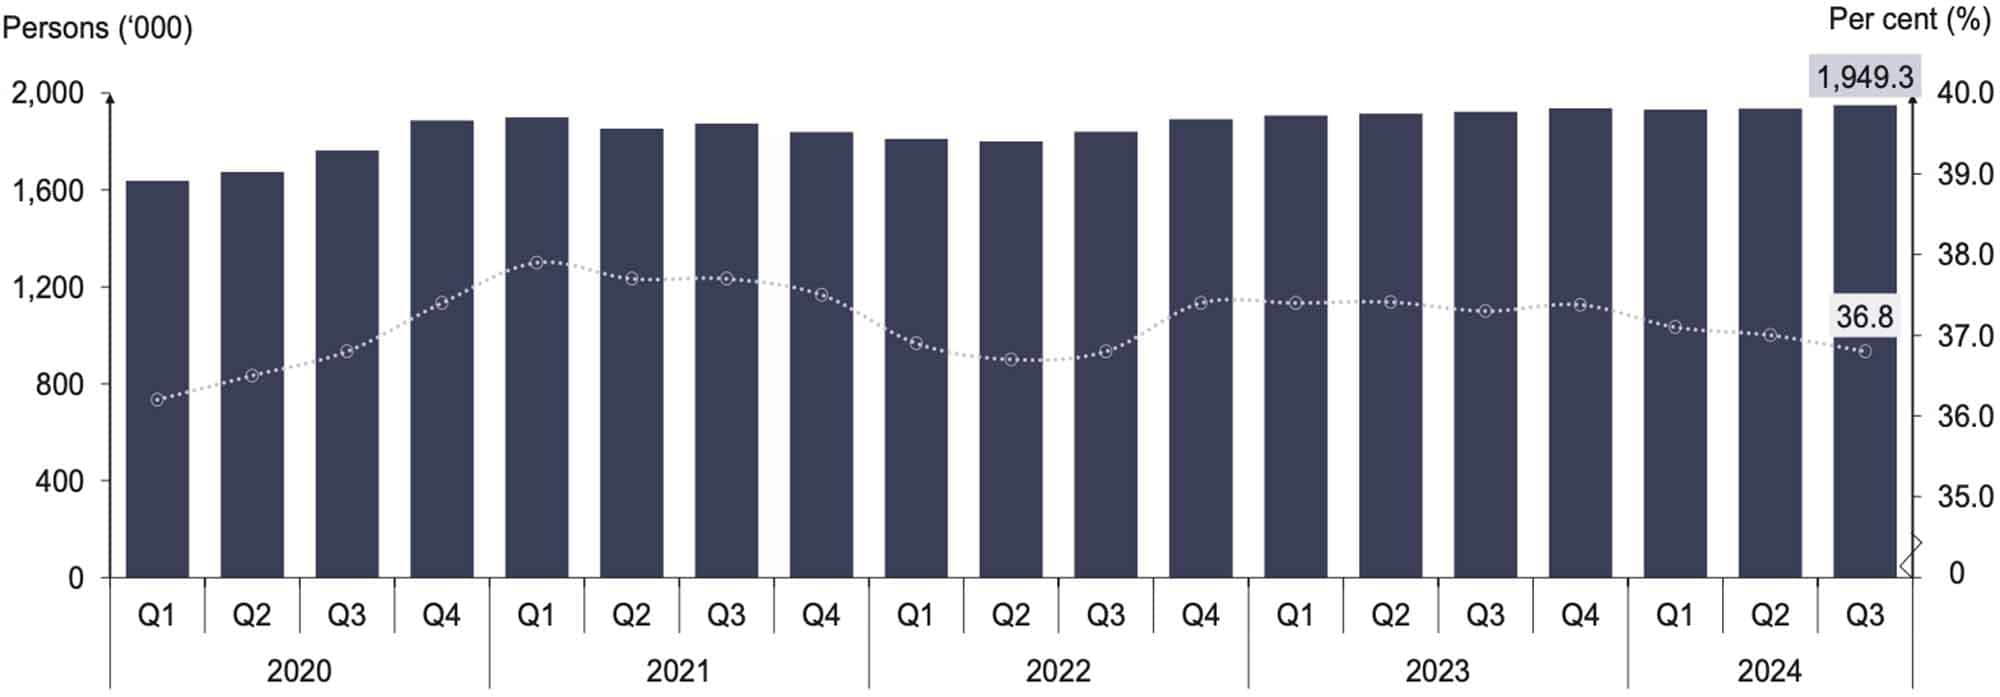
Meanwhile, the skill-related underemployment which encompassed those with tertiary education but working in semi-skilled and low-skilled occupations, showed a positive growth of 0.7 per cent to record 1.95 million persons. As for quarter-on-quarter comparison, those who were in the skill-related underemployment also rose by 0.7 per cent (+13.4 thousand persons) compared to Q2 2024. Furthermore, the rate of skill-related underemployment to employed persons with tertiary education declined slightly by 0.2 percentage points to 36.8 per cent (Q2 2024: 37.0%) (Chart 26).
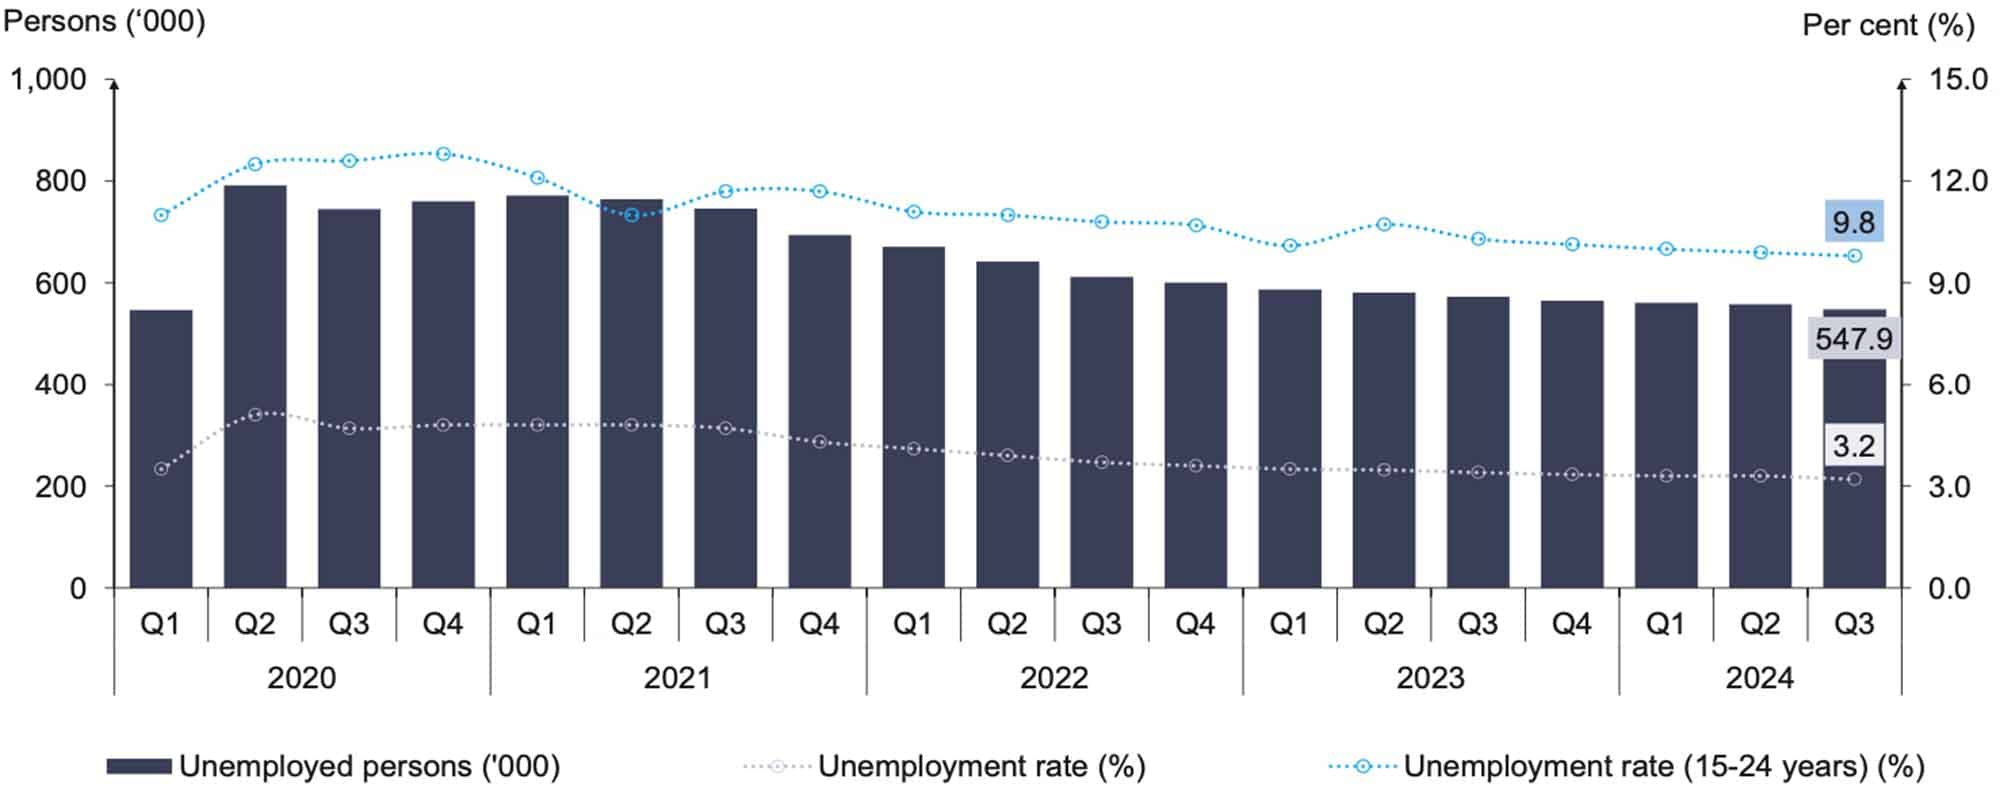
During Q3 2024, the number of unemployed persons declined by 4.4 per cent (-25.2 thousand) compared to the same quarter in the previous year, reaching 547.9 thousand. Likewise, the national unemployment rate recorded 3.2 per cent after registering a year-on-year decrease of 0.2 percentage points. The same trend persisted from the previous quarter, whereby the number of unemployed person lowered by 1.8 per cent (-9.9 thousand), while the unemployment rate decreased by 0.1 percentage point to 3.2 per cent in Q3, indicating a growing labour force and an increasing labour force participation rate (Chart 27).
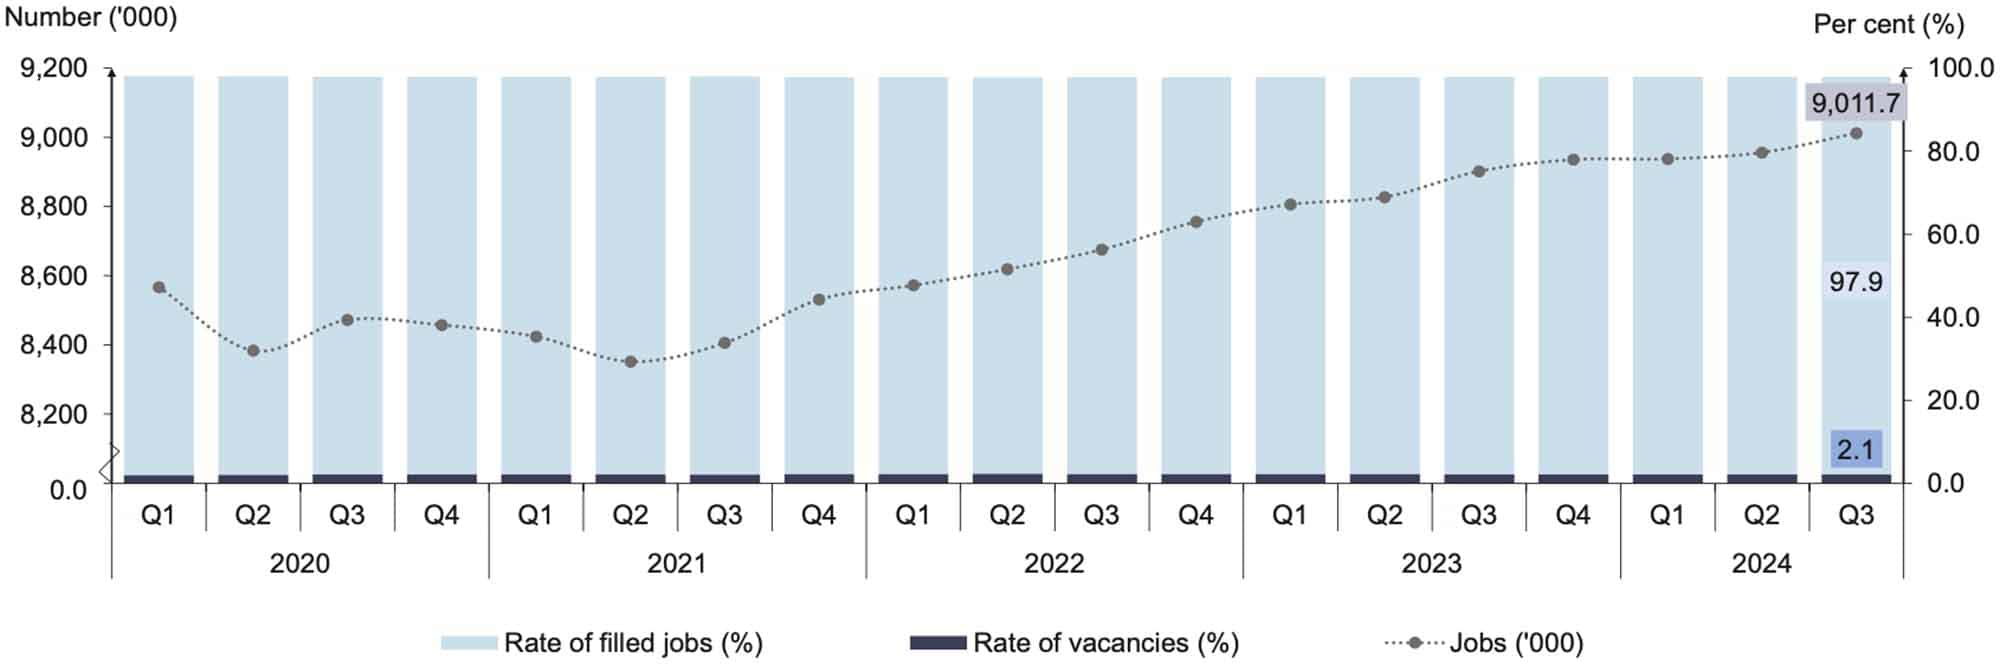
Labour demand recorded the highest number compared to the previous quarter. During Q3 2024, labour demand continued its upward trend, with job numbers in the economic sector rising by 1.2 per cent (+109.2 thousand) year-on-year, to record a total of 9.01 million jobs. On a quarterly basis, job numbers grew modestly by 0.6 per cent (+56.7 thousand), indicating stable growth in labour demand during the quarter.
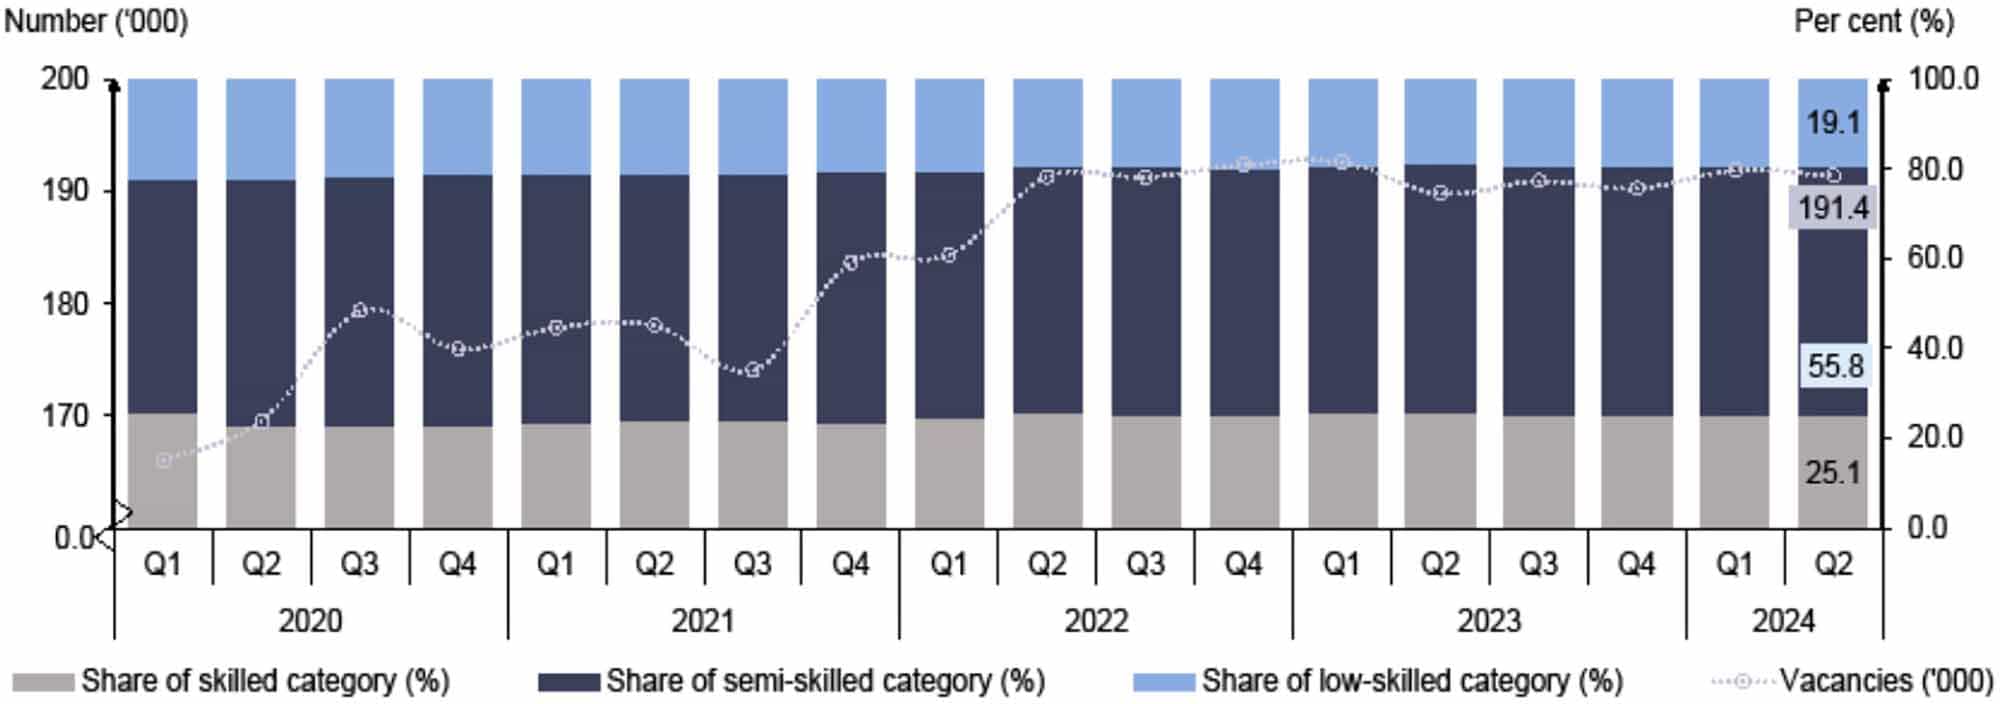
In this quarter, the number of filled jobs recorded was 8,820 thousand, remained at 97.9 per cent. Next, the vacancy rate also stayed at 2.1 per cent with 191.8 thousand vacancies. However, both rates did not change from the previous quarter (Chart 28).
Breaking down by economic activity, the Services sector was the main contributor with a percentage share of 51.8 per cent of total jobs (4.67 million), followed by the Manufacturing sector with 27.6 per cent (2.49 million). The Construction and Agriculture sectors made up 14.1 per cent (1.27 million) and 5.6 per cent (501.0 thousand) of total jobs, respectively. Meanwhile, the Mining & Quarrying sector held the smallest share of total jobs, with 0.9 per cent or equivalent to 80.2 thousand jobs.
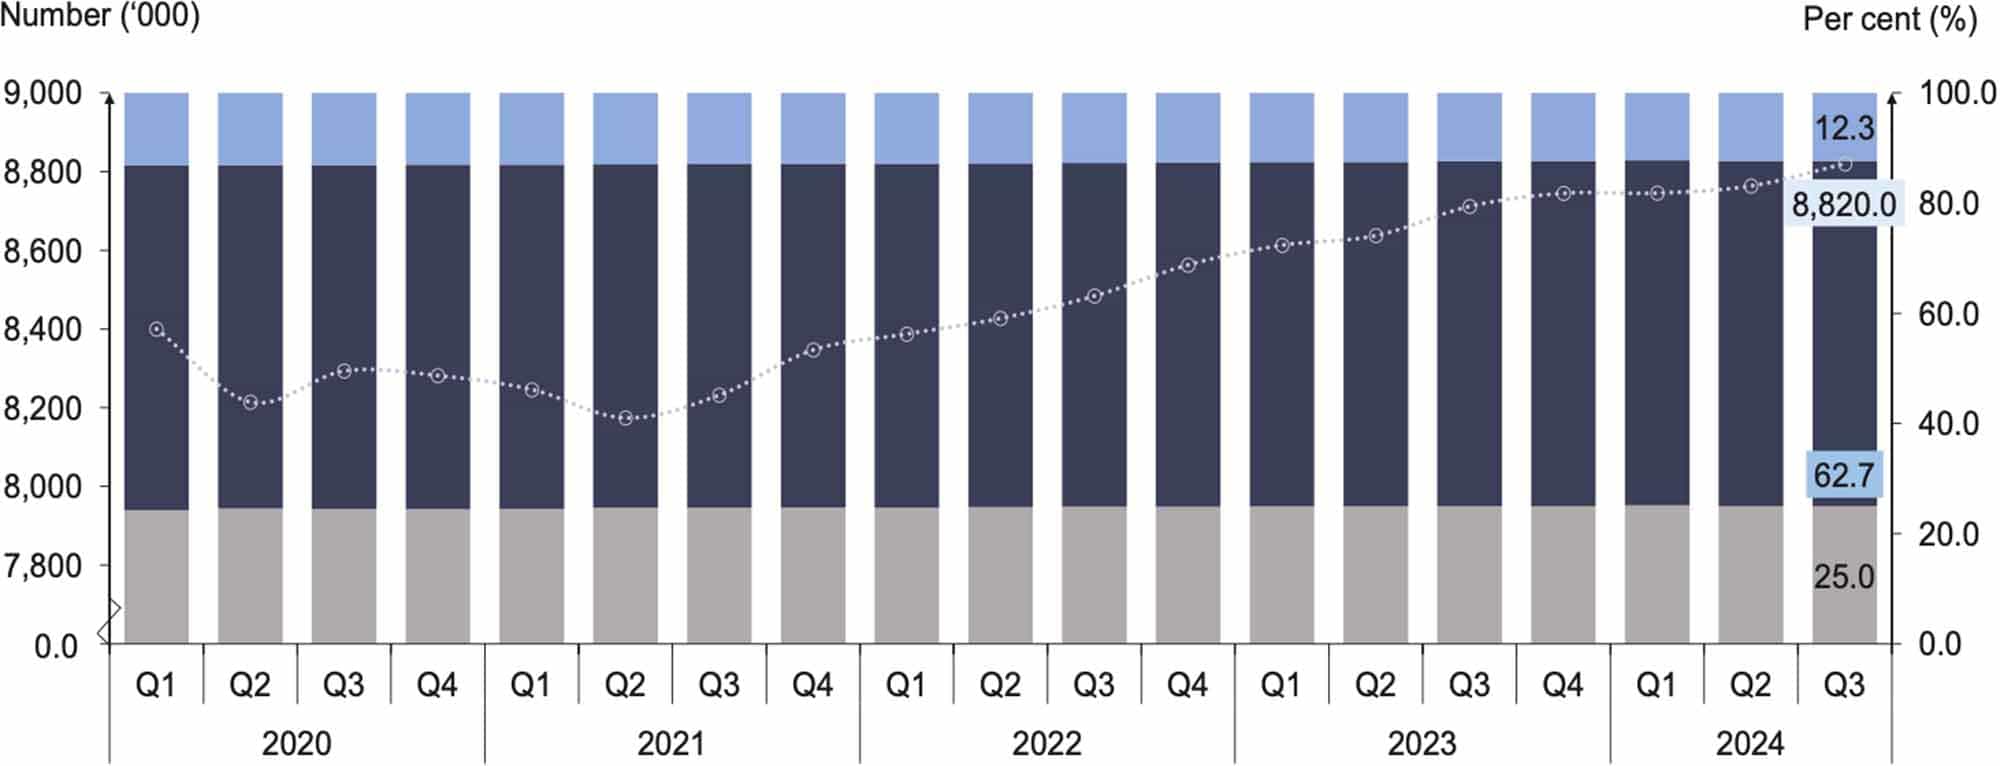
In terms of composition by skills category for filled jobs, the semi-skilled category contributed the largest share in this quarter, representing 5.53 million filled jobs (62.7%). It was followed by the skilled category, with 2.21 million filled jobs (25.0%) and the low-skilled category with 1.09 million filled jobs (12.3%). By economic activity, the Services sector accounted for 51.8 per cent or equivalent to 4,671 thousand jobs. The Manufacturing sector came next with a share of 27.6 per cent, totalling 2,489 thousand jobs. Meanwhile, the Construction and Agriculture sectors accounted for 14.1 per cent (1,270 thousand) and 5.6 per cent (501 thousand) of the filled jobs, respectively. The Mining & Quarrying sector had the lowest proportion at 0.9 per cent, recording 80 thousand filled jobs (Chart 29).
Analysing the job vacancies by skills category, the semi-skilled category marked the largest share, comprising 55.9 per cent (107.1 thousand). The skilled category represented 24.8 per cent of the total job vacancies came next, totalling 47.5 thousand vacancies, followed by the low-skilled catgory with 36.8 thousand vacancies (19.1%). In terms of composition by economic activity, the Manufacturing sector was the largest contributor of job vacancies, comprising 56.9 per cent (109.1 thousand). It was then followed by the Agriculture and Construction sector with 16.7 per cent (32.0 thousand) and 13.2 per cent (25.4 thousand) respectively (Chart 30).
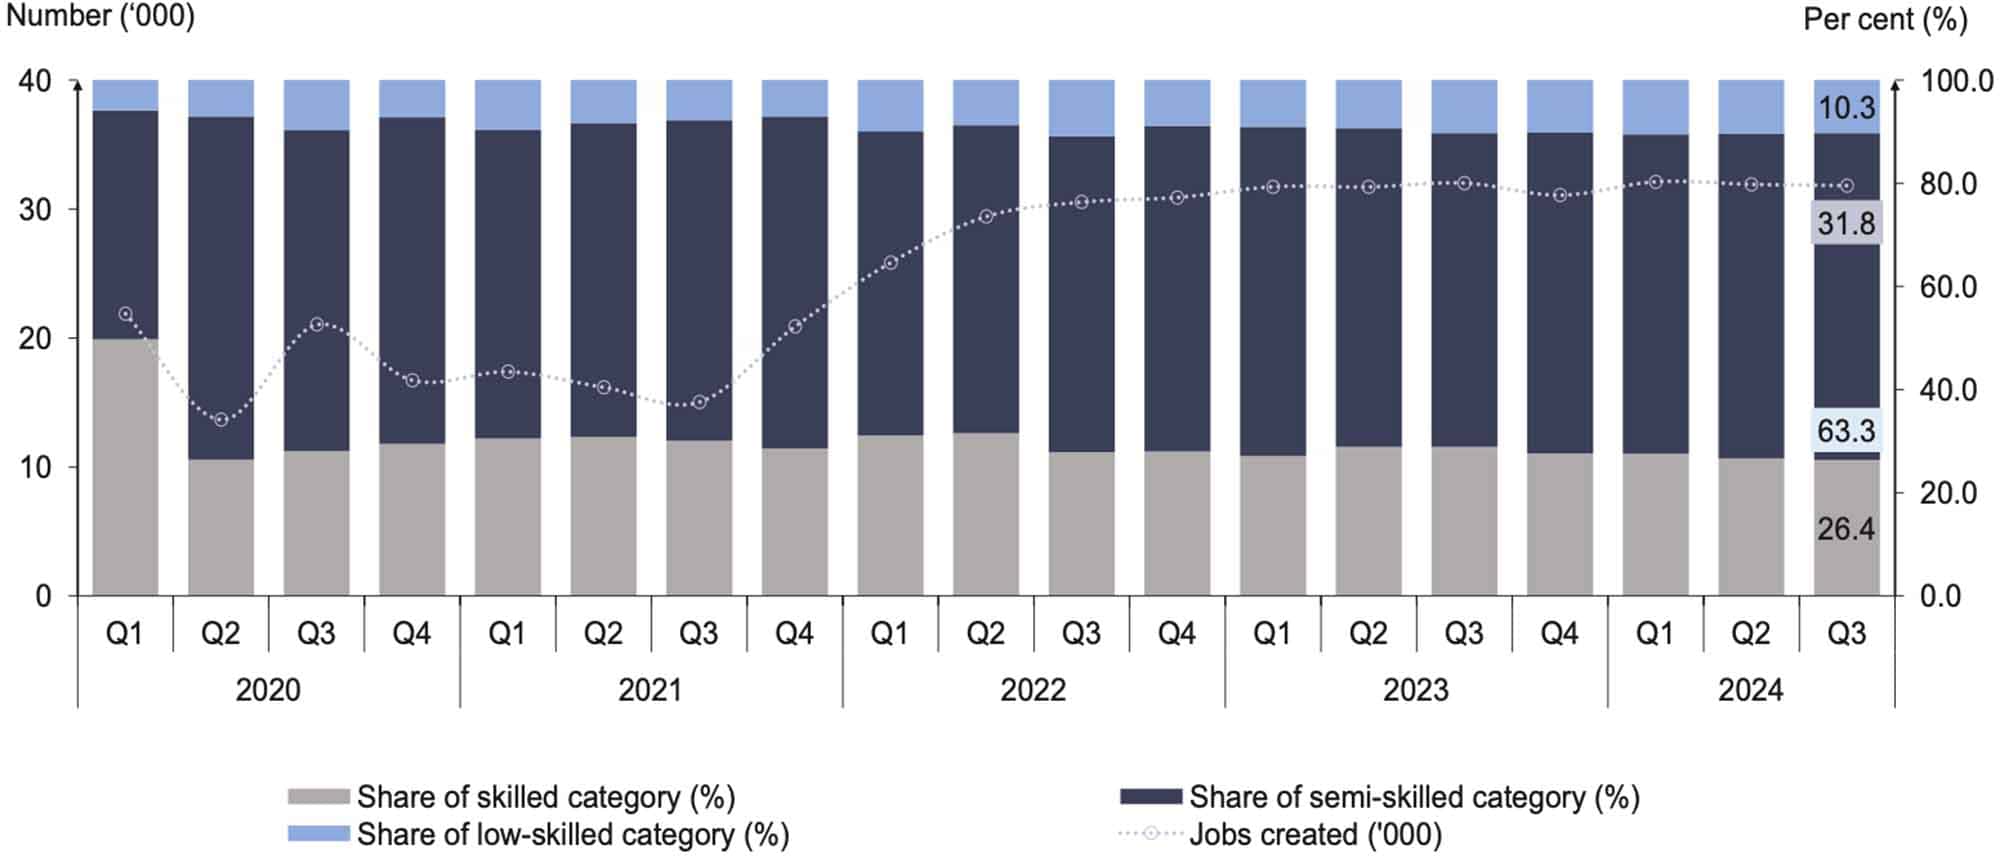
Breaking down the jobs created by skills category, more than half or 63.3 per cent of total jobs created in Q3 2024 were concentrated in the semi-skilled category registering 20.1 thousand jobs. The skilled category ranked second with a share of 26.4 per cent of total jobs created to record 8.4 thousand newly added jobs, followed by the low-skilled category which accounted for 10.3 per cent (3.3 thousand) in this quarter. As for the economic activity, the jobs created in the Services sector was 49.5 per cent (15.7 thousand), while Manufacturing came in second with 34.4 per cent (10.9 thousand), followed by Construction at 11.5 per cent (3.7 thousand) (Chart 31).
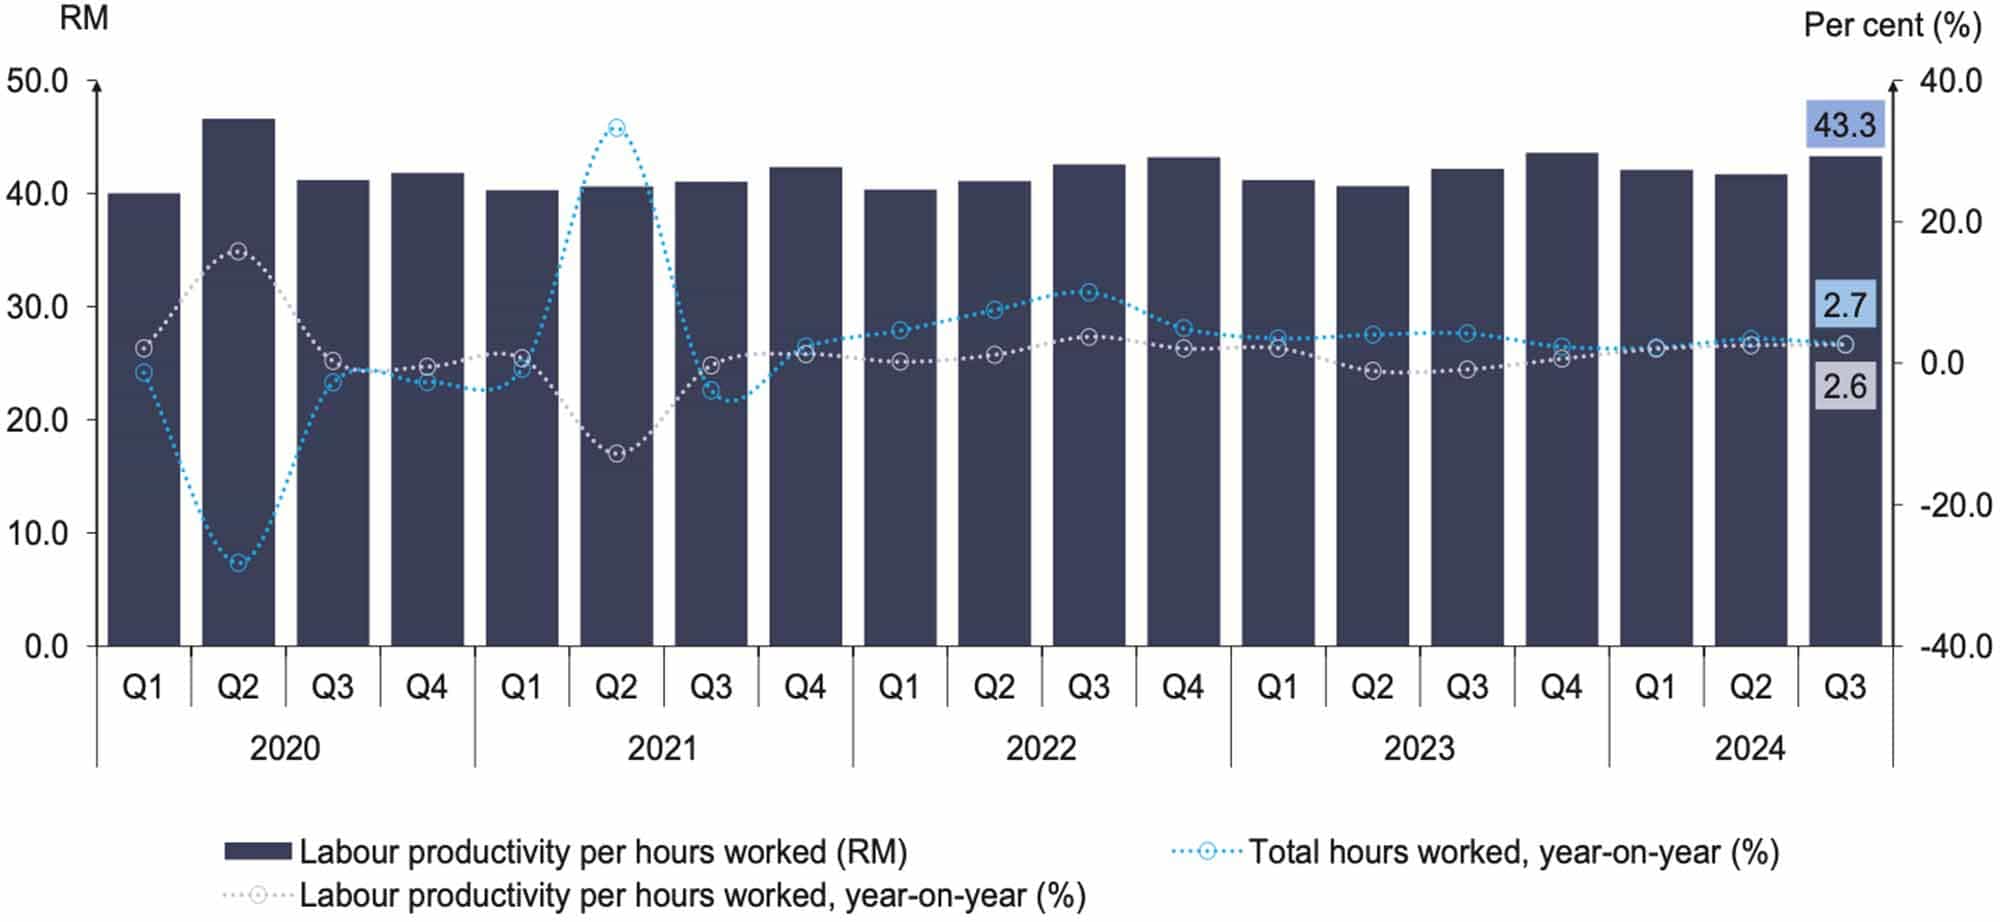
Looking at year-on-year performance, labour productivity as measured by value added per hour worked rose by 2.6 per cent in Q3 2024 after registering an increase of 2.5 per cent in the previous quarter, to bring the level of productivity at RM43.3 per hour. On a quarterly basis, total hours worked increased by 0.6 per cent, registering slightly slower growth of 1.1 per cent in Q3 2024 (Chart 32).
Looking at labour productivity per hour worked by economic sector in Q3 2024, all sectors showed annual positive growth, except the Mining & Quarrying sector, which registered a decrease of 5.7 per cent, following a 3.7 per cent increase in the previous quarter. Meanwhile, the Construction sector escalated the highest by 20.1 per cent in labour productivity per hour worked, surpassing a 19.1 per cent increase in the previous quarter.
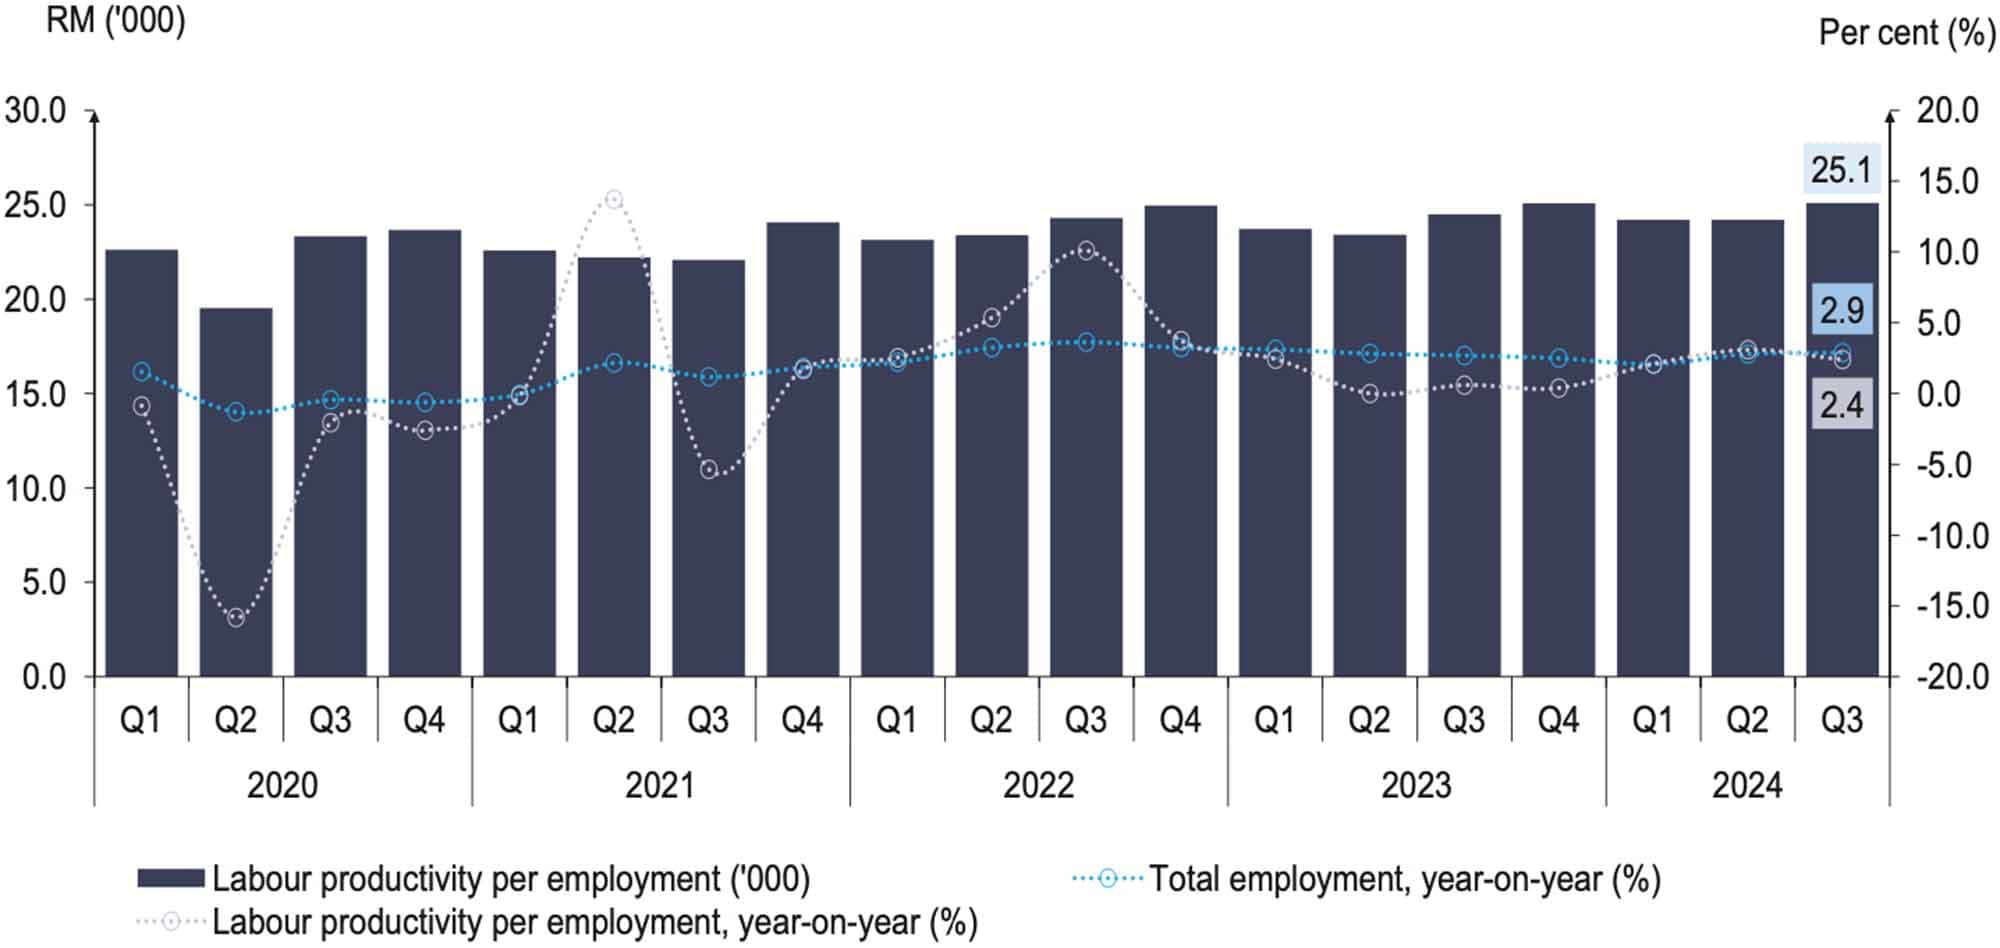
Meanwhile, labor productivity which was measured as value added per employment, increased by 2.4 per cent to reach RM25,077 per person in Q3 2024. As for the total employment, there was also an increase of 2.9 per cent, totalling 16.7 million employments (Q2 2024: 16.6 million employments) (Chart 33).
Breaking down by economic sectors, labour productivity per employment in all sectors showed positive year-on-year growth in Q3 2024 except Mining & Quarrying sector which recorded a decrease at 4.0 per cent. Meanwhile, the highest increase was contributed by the Construction sector at 18.9 per cent, then followed by Services (1.2%), Manufacturing (4.1%) and Agriculture sector (2.9%).
Malaysia’s labour market has remained on a steady growth in Q3 2024, supported by consistent rises in both supply and demand. The number of employed persons continued to be on a positive trend while rate of unemployment declined 3.2 per cent since being stagnant at 3.3 percent in the last three preceding quarters. Looking at the third quarter of this year, the labour demand in the industries recorded the highest number since 2018. The number of jobs continued on upward trend which was in line with the decrease in unemployment rate, due to rise in filled jobs in slight decrease of jobs created. Nonetheless, there was a marginal increase in the number of vacancies, reflecting that there were more job opportunities throughout the quarter. As for labour productivity, both value added per employment and value added per hour worked achieved a significant rises as against the same quarter in 2023.
It is anticipated that Malaysia's economy will continue to grow in Q4 2024, supported by effective policy measures and growing consumer confidence. Hence, the overall labour market performance is anticipated to remain resilient, supporting sustained employment opportunities and recovery in various sectors in line with the current positive economic developments in the upcoming quarters.
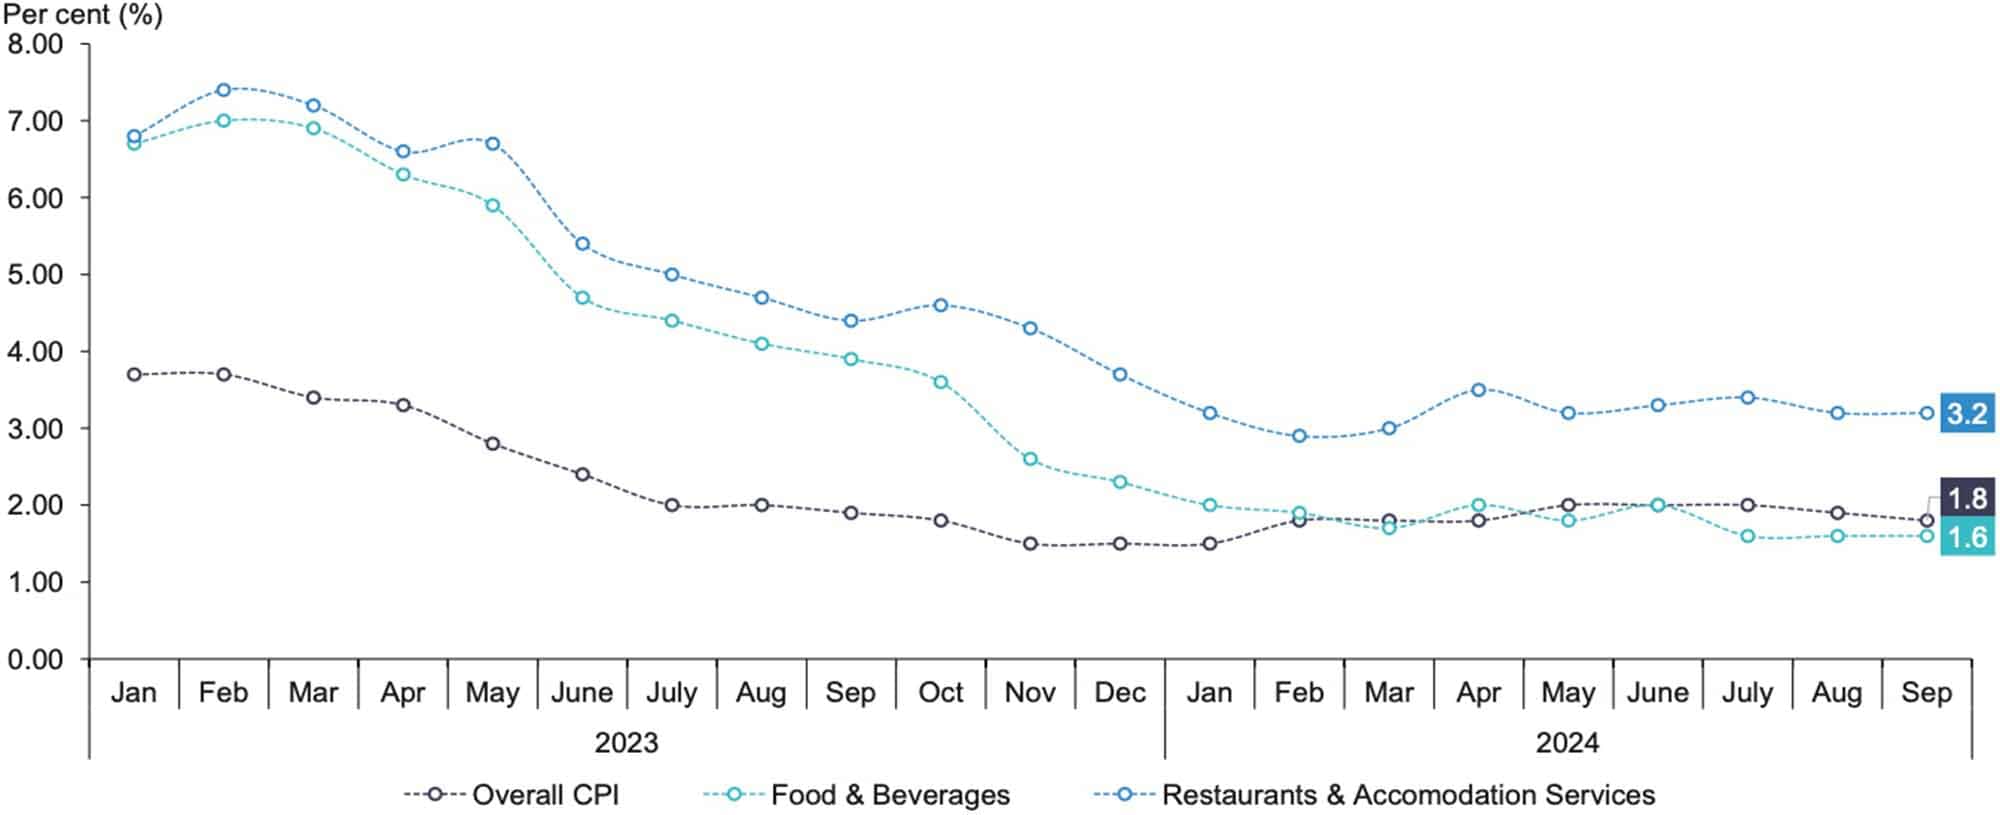
Malaysia’s inflation rate eased to 1.8 per cent in September 2024, compared to 1.9 per cent in August 2024 (Chart 34). The moderation was driven by slower increases in the main groups, including Personal Care, Social Protection & Miscellaneous Goods & Services, 3.1 per cent (August 2024: 3.2%); Transport, 1.1 per cent (August 2024: 1.3%); Furnishings, Household Equipment & Routine Household Maintenance, 0.6 per cent (August 2024: 0.7%) and Information & Communication, 0.4 per cent (August 2024: 0.5%).
However, Recreation, Sport & Culture recorded a marginal increase to 2.1 per cent as compared to August 2024 (2.0%). Meanwhile, Restaurant & Accommodation Services (3.2 per cent), Housing, Water, Electricity, Gas & Other Fuels (3.1%), Food & Beverages (1.6 %), Health (1.6%), and Education (1.5%) stood at the same rates as the previous month. Clothing & Footwear remained in negative trend, declining further to negative 0.3 per cent (August 2024: -0.2%)
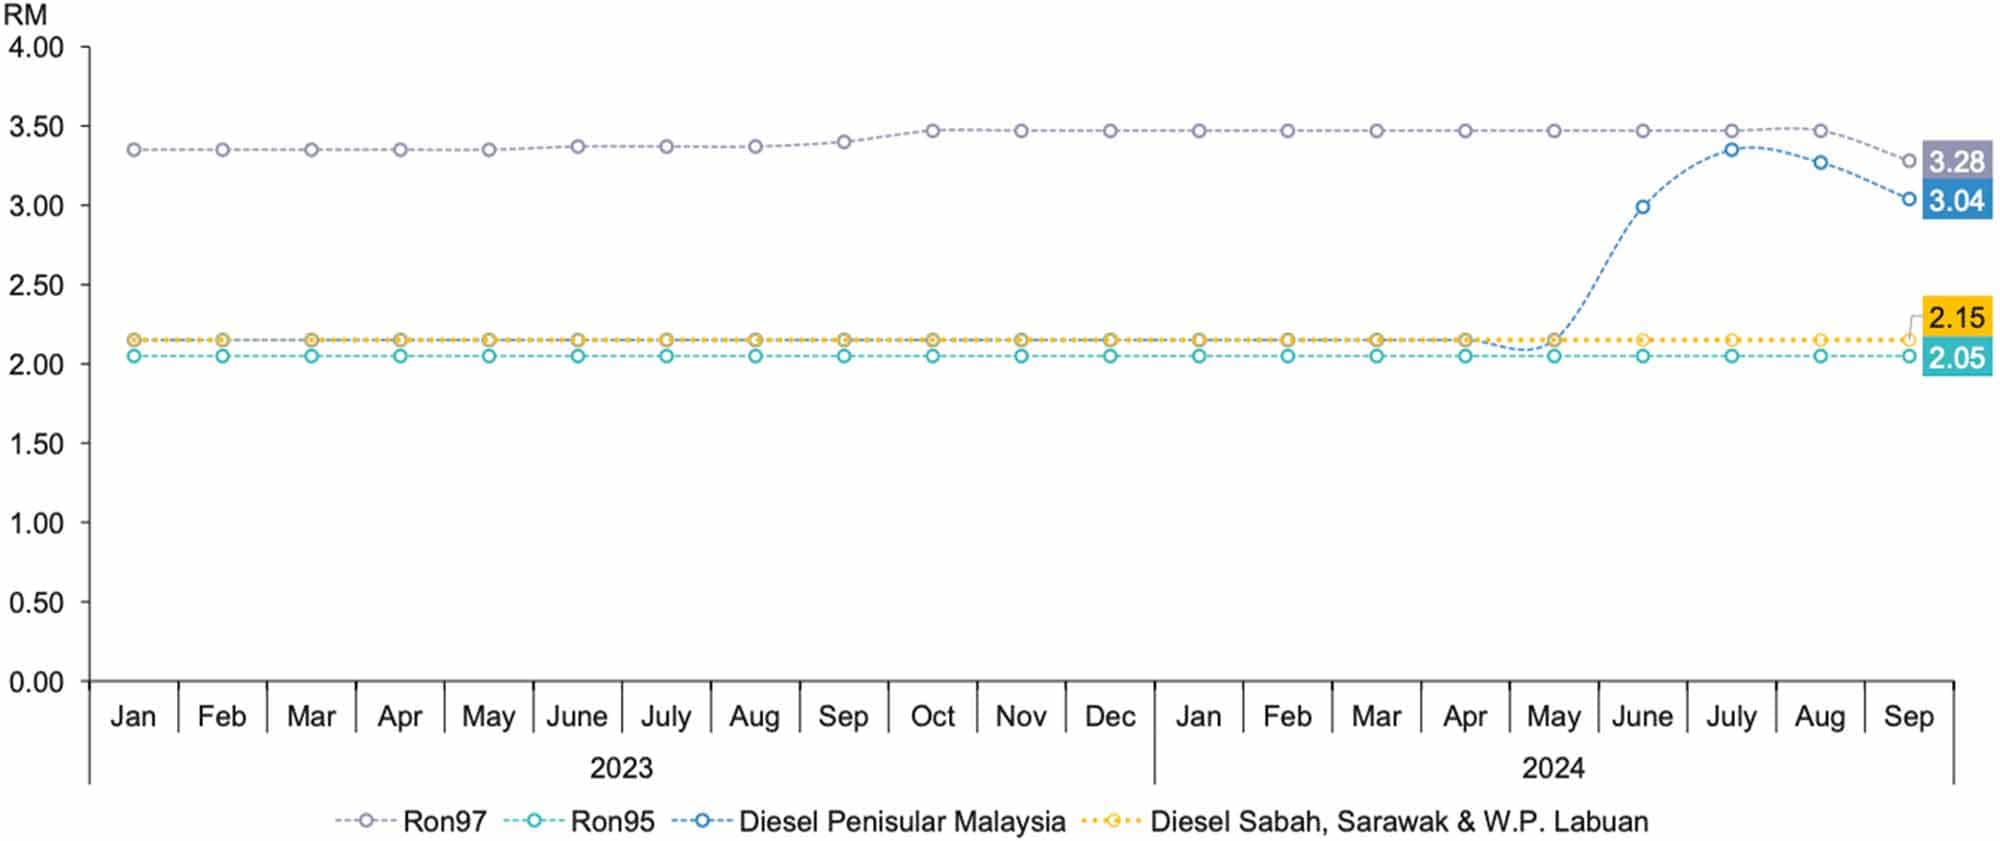
The inflation for the main group of Transport increased at a slower pace to 1.1 per cent in September 2024 as compared to 1.3 per cent in August 2024. The increase was mainly contributed by the subgroup of Operation of personal transport equipment which eased to 1.4 per cent as compared to August 2024 (1.8%). The increase in the expenditure class of Fuels & lubricants for personal transport equipment to 0.4 per cent as compared to August 2024 (1.2%) has contributed to the increase of this subgroup.
The increment was in line with the increase in the average price of Diesel in Peninsular Malaysia, RM3.04 per litre (September 2023: RM2.15 per litre) and slowed down in the average price of Unleaded petrol RON97, RM3.28 per litre (September 2023: RM3.40 per litre) (Chart 35).
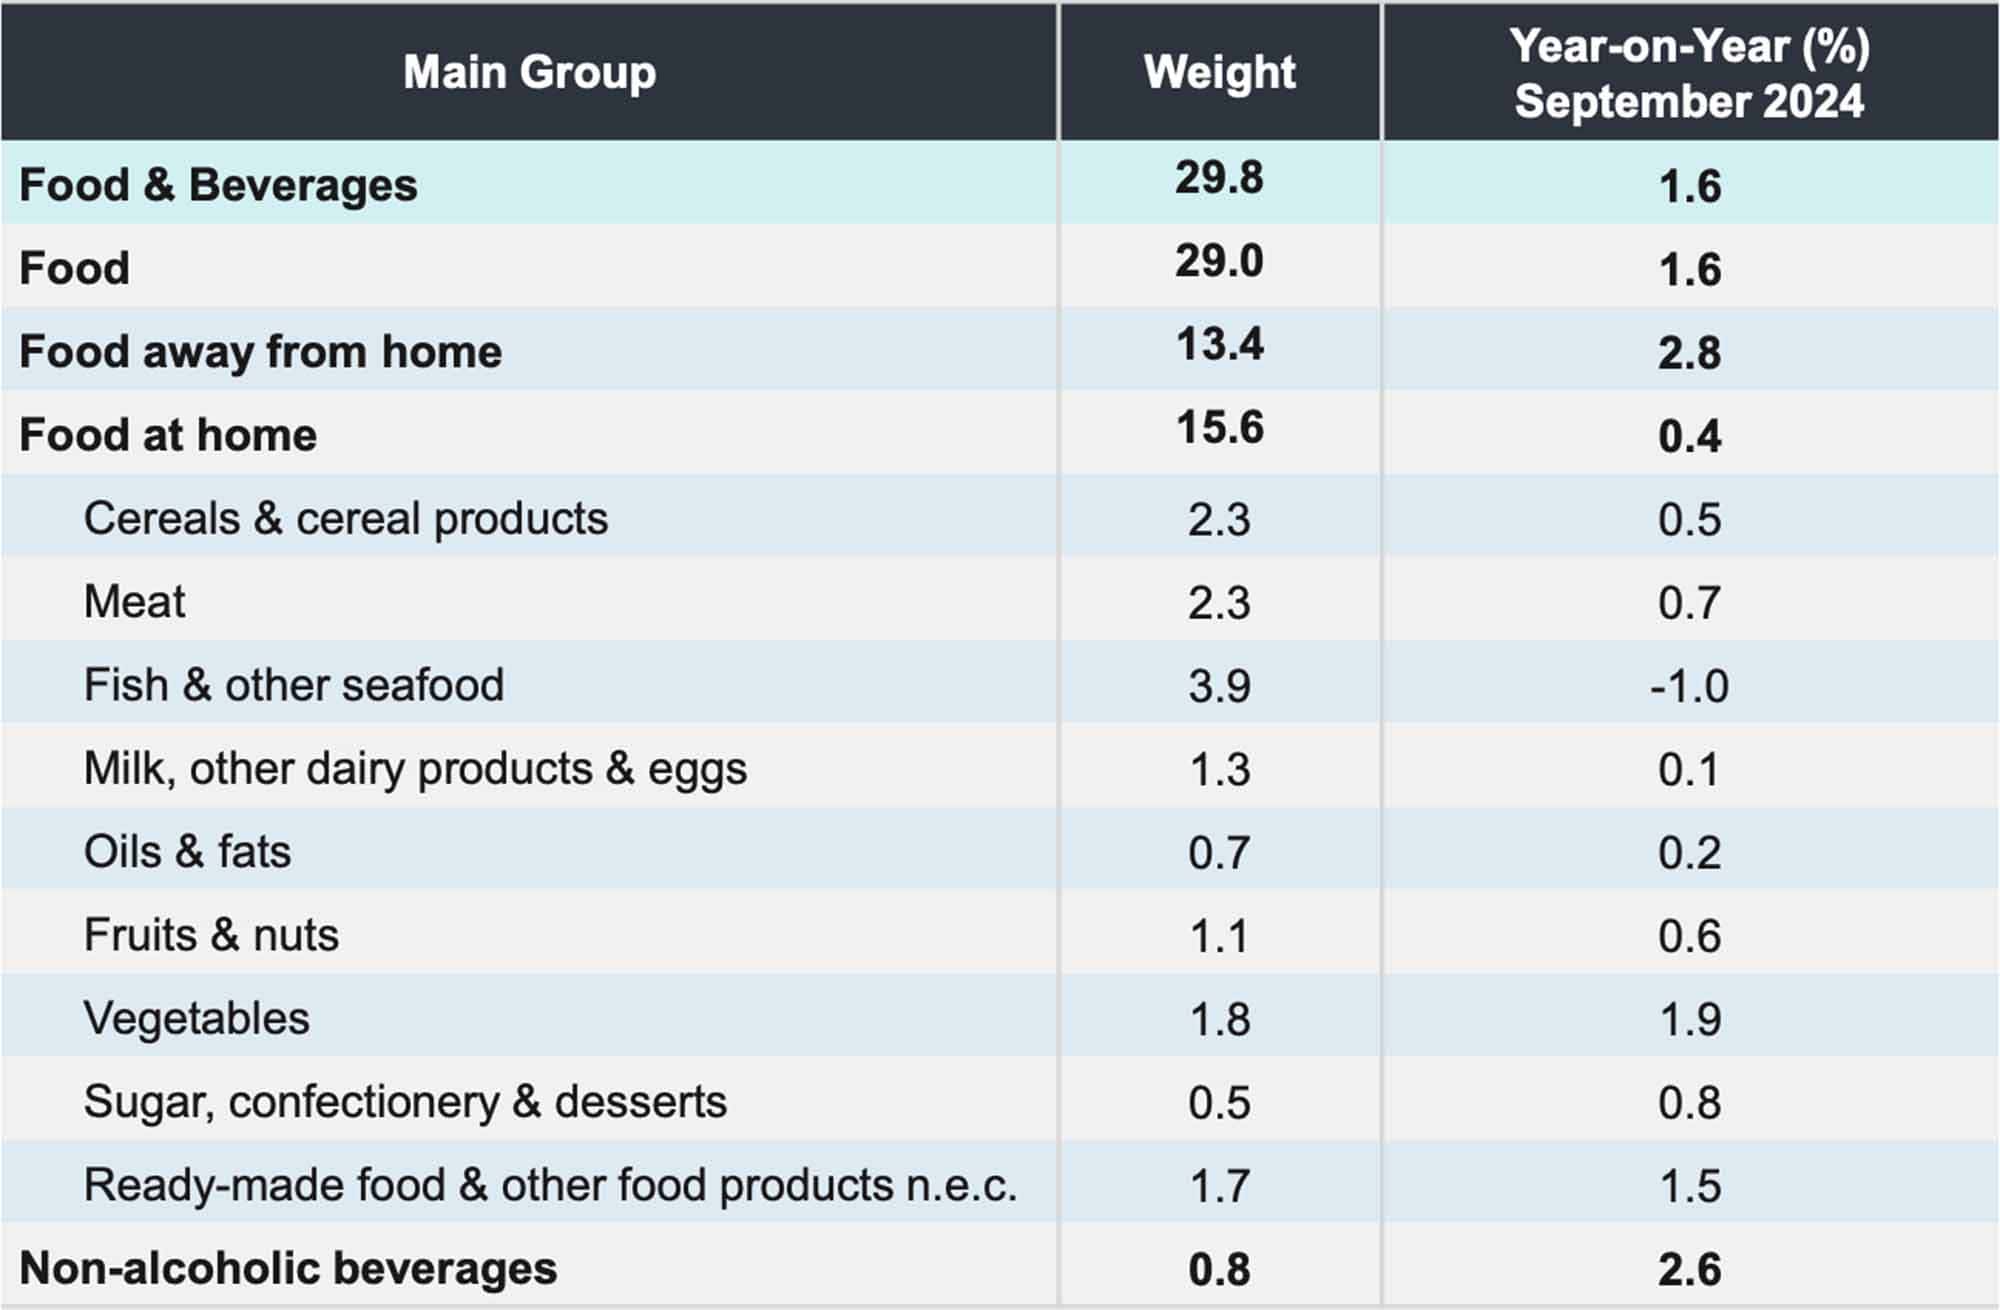
The Food & Beverages group which contributes 29.8 per cent of the total Consumer Price Index (CPI) weight rose 1.6 per cent, the same rate as recorded since July 2024. Out of the 247 Food items, 144 items (58.3%) recorded price increases as compared to September 2023. The main subgroup of Food at home which contributes 52.0 per cent of total Food & Beverages group recorded a marginal increase to 0.4 per cent as compared to August 2024 (0.3%) (Table 11).
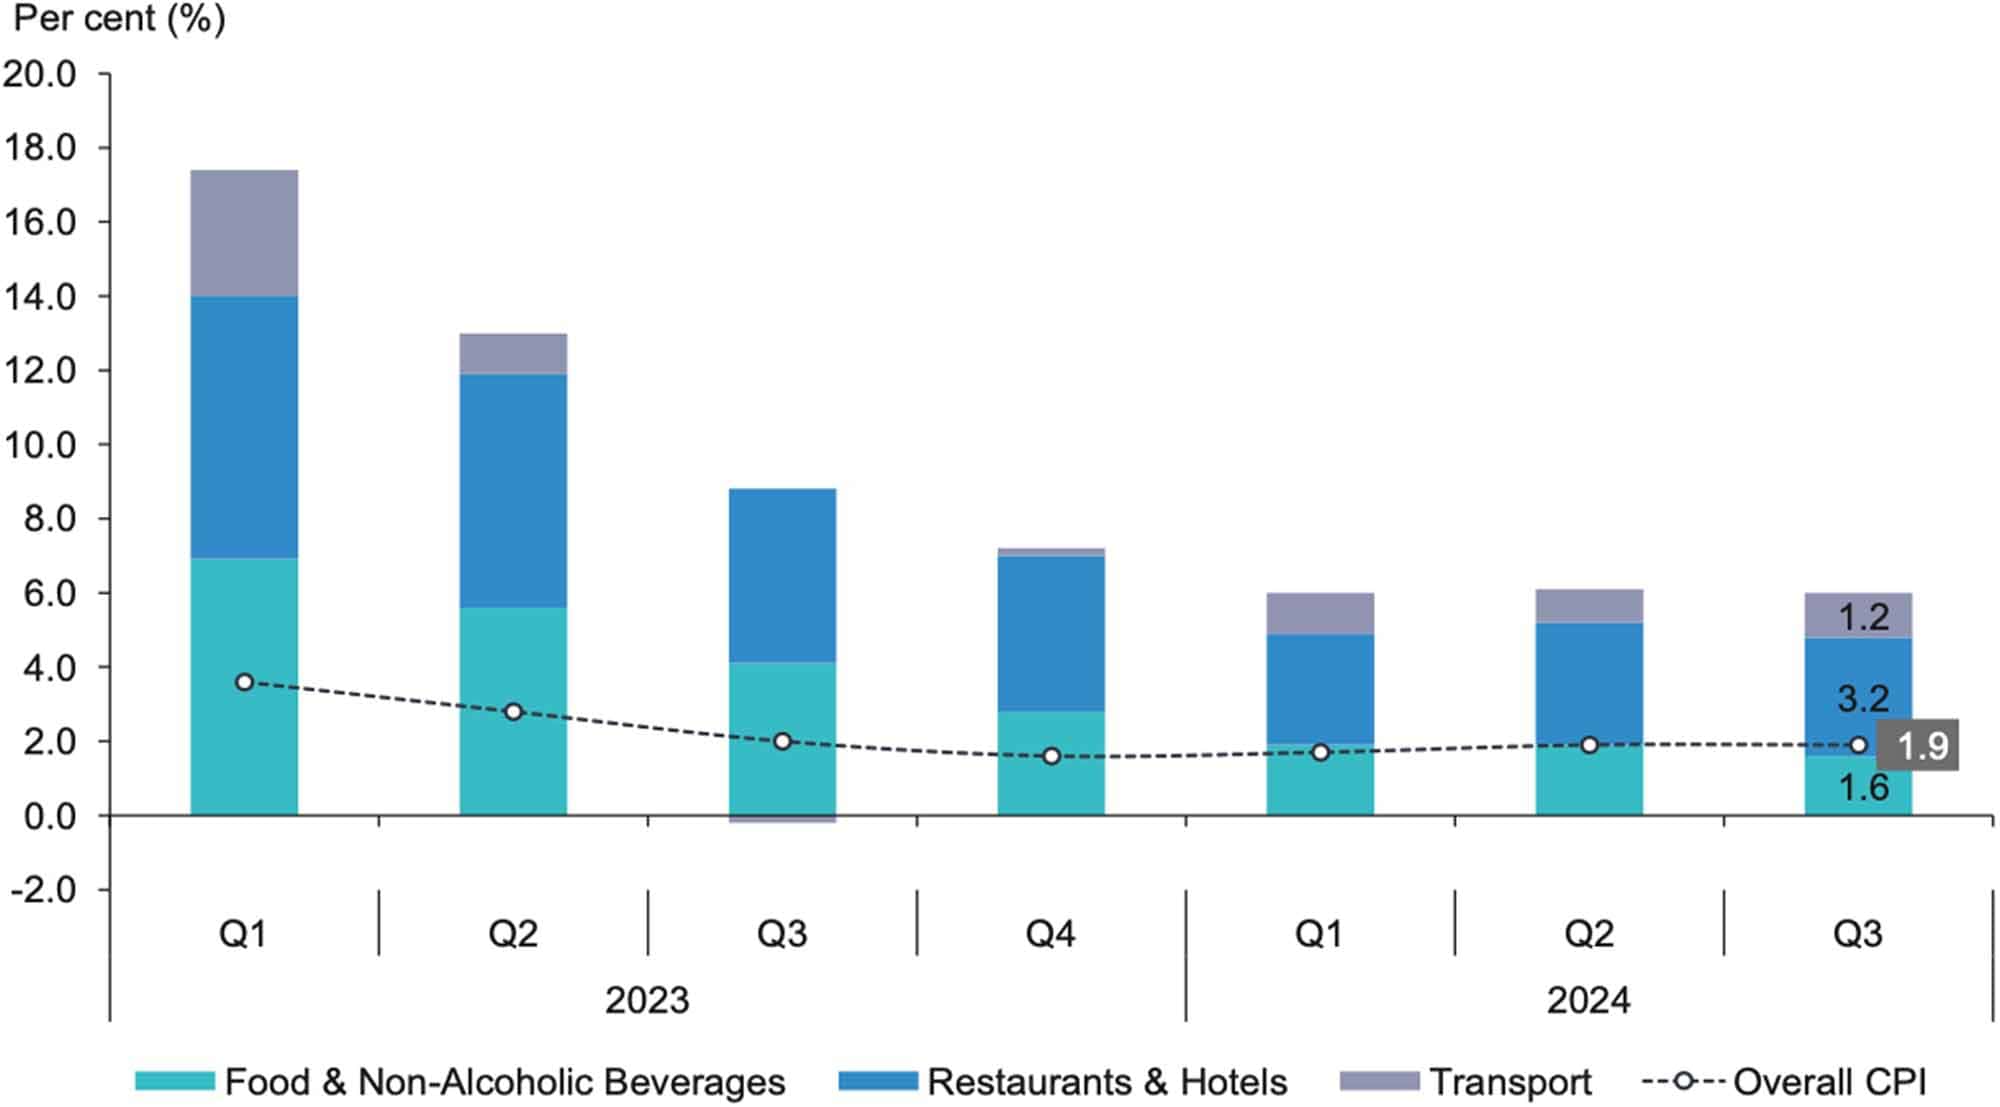
Meanwhile, the inflation for the third quarter of 2024 expanded by 1.9 per cent to 133.2 as against to 130.7 in the same quarter of the preceding year (Q2 2024: 1.9%). As for quarter-on-quarter basis, the inflation recorded a slower positive growth of 0.4 per cent as compared to 0.6 per cent in the second quarter of 2024 (Chart 36).
The weather uncertainties in the main planting areas are also affecting the current supply in the domestic market. This is subsequent to the high rainfall since the end of September 2024, which resulted from the monsoon transition phase, also impacting crops and agricultural activities. According to the Malaysian Meteorological Department, the monsoon transition phase will continue until the early of November 2024 and it is expected that the prices of certain vegetables will remain high.
Malaysia’s Producer Price Index decreased by 2.1 per cent in September 2024, compared to a 0.3 per cent increase in the previous month. This marks the second decline recorded for the year 2024, following a consecutive seven-month increase.
The decrease in PPI Local Production for September 2024 was primarily influenced by the Mining sector, which posted a double-digit decrease of 16.1 per cent (August 2024: -8.3%). Within this sector, the indices for both Extraction of crude petroleum and Extraction of natural gas dropped by 18.6 per cent and 7.9 per cent, respectively. At the same time, the Manufacturing sector contracted by 1.5 per cent (August 2024: 1.0%), largely due to the Manufacture of coke & refined petroleum products index, which fell by 18.7per cent.
Meanwhile, the Agriculture, forestry & fishing sector increased by 5.8 per cent (August 2024: 2.7%) with the Growing of perennial crops index recording an increase of 11.2 per cent. For Utility sector, the Water supply index edged up by 7.8 per cent, while the Electricity & gas supply index went up by 0.3 per cent.
On a monthly basis, PPI Local Production continued to decline by 1.5 per cent in September 2024 (August 2024: -0.9%). Most sectors recorded decreases except for the Agriculture, Forestry & Fishing sector, which rose by 1.6 per cent (August 2024: -2.7%). However, the Mining sector dropped by 3.4 per cent (August 2024: -6.8%) and the Manufacturing sector continued its decline contracting by 1.7 per cent (August 2024: -0.2%). Similarly, the Water supply sector went down by 0.5 per cent and the Electricity & gas supply declined 0.3 per cent (Table 12).
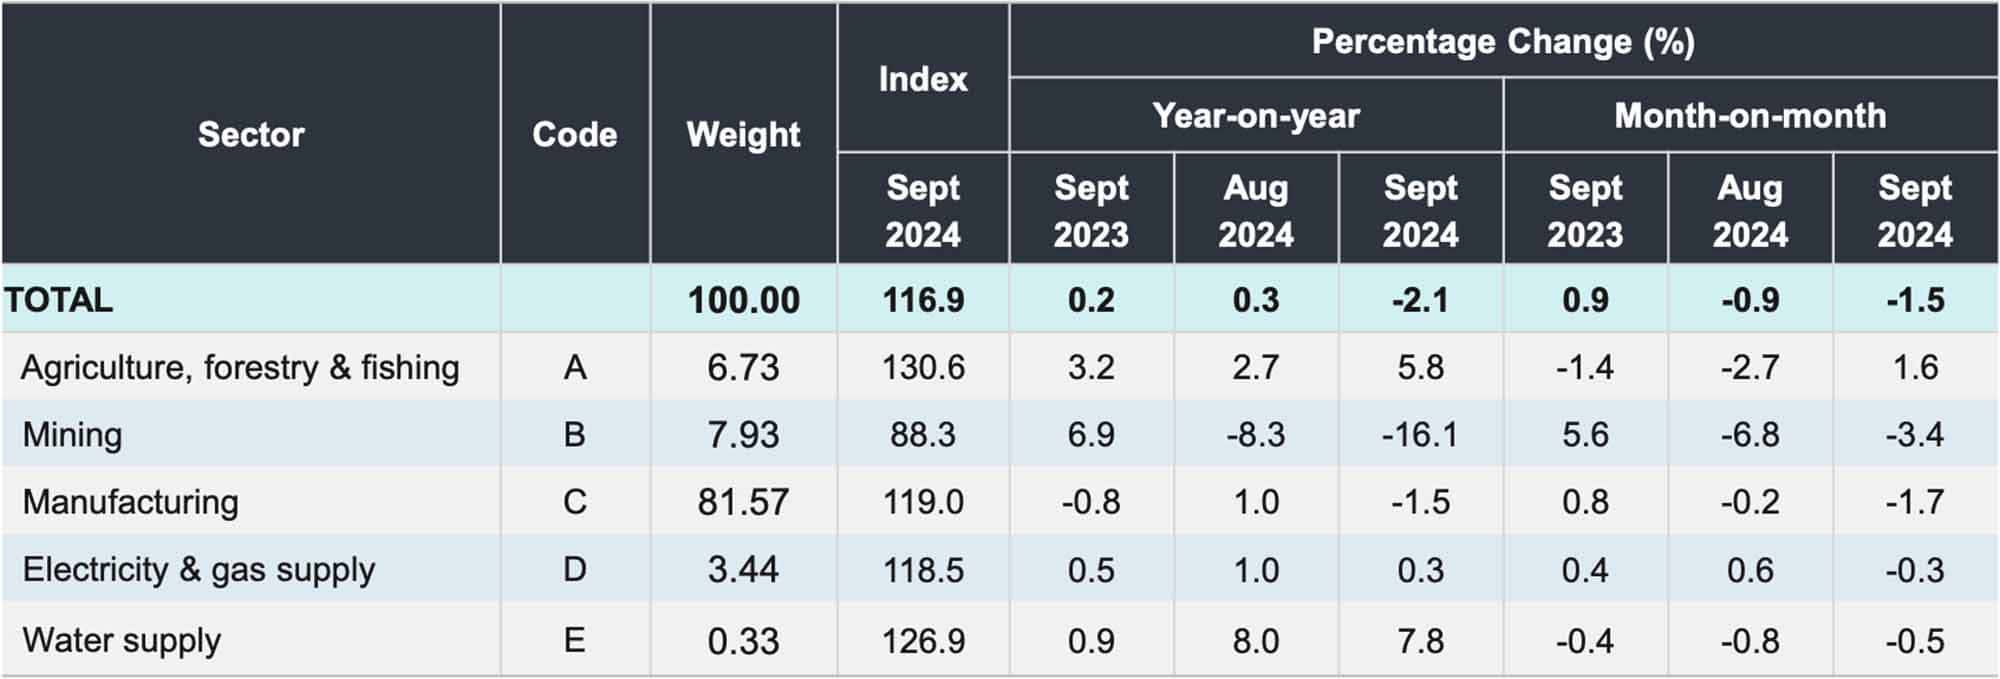
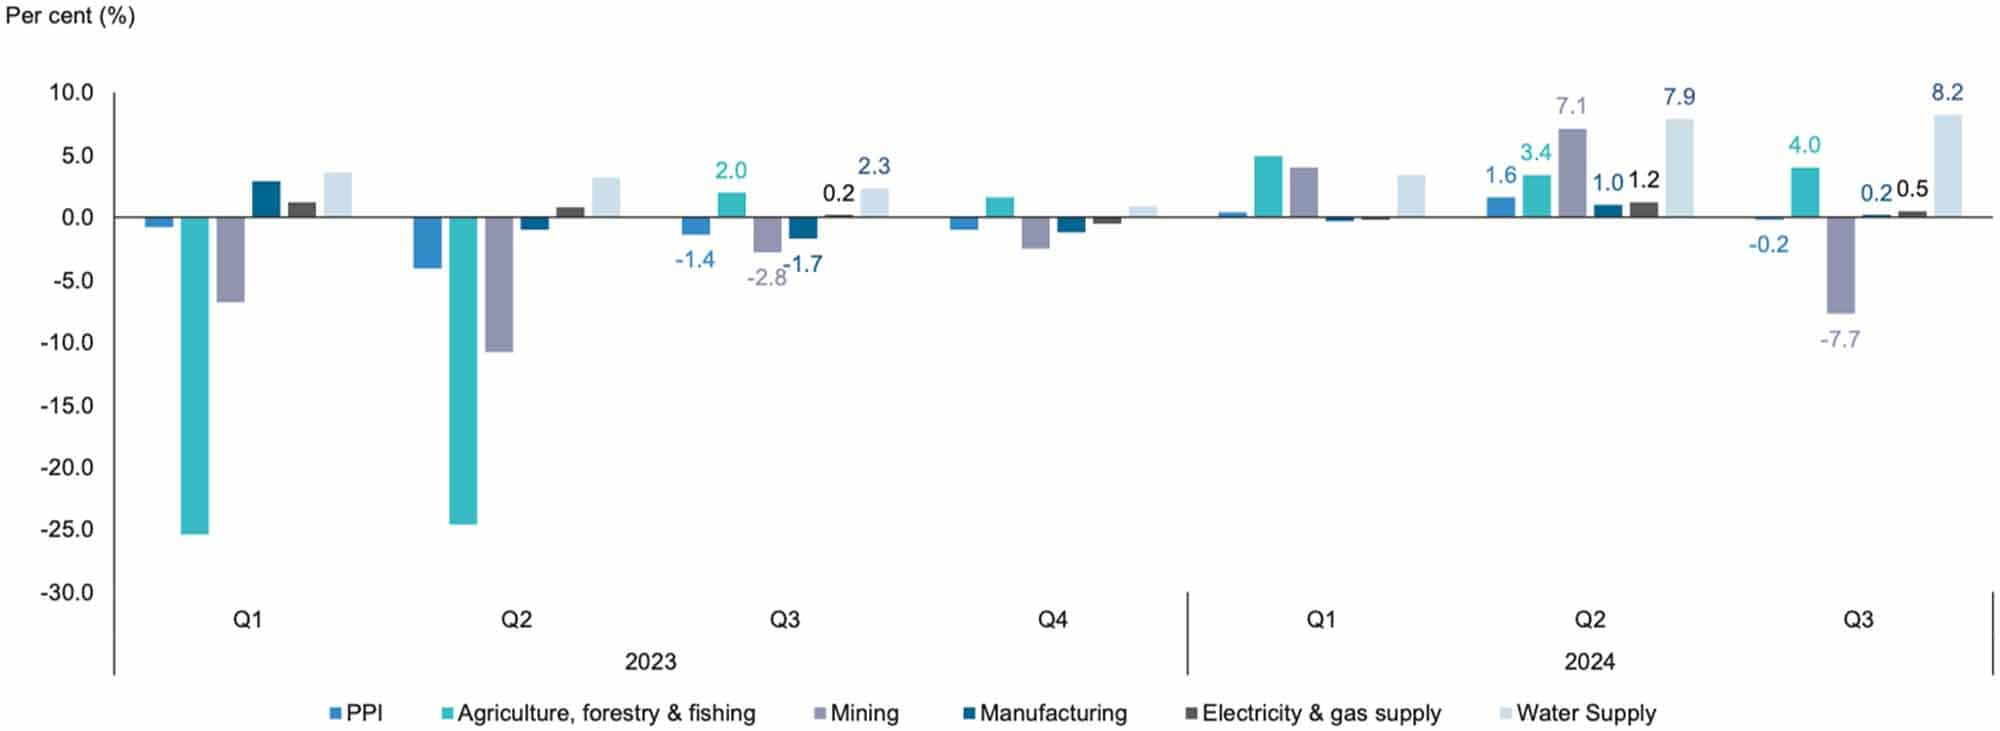
PPI Local Production recorded a marginal decrease of 0.2 per cent in the third quarter of 2024 compared to an increase of 1.6 per cent in the second quarter of 2024. This decline was mainly attributed to the Mining sector, which contracted by 7.7 per cent. Conversely, the Agriculture, forestry & fisheries sector increased by 4.0 per cent, while the Manufacturing sector inched up by 0.2 per cent. In the meantime, Water supply and Electricity & gas supply rose by 8.2 per cent and 0.5 per cent, respectively. Meanwhile, PPI shrank by 1.6 per cent on a quarter-on-quarter basis, compared to a 1.1 per cent decline in the second quarter of 2024. This contraction was attributed to decreases across all sectors except for the Water supply.
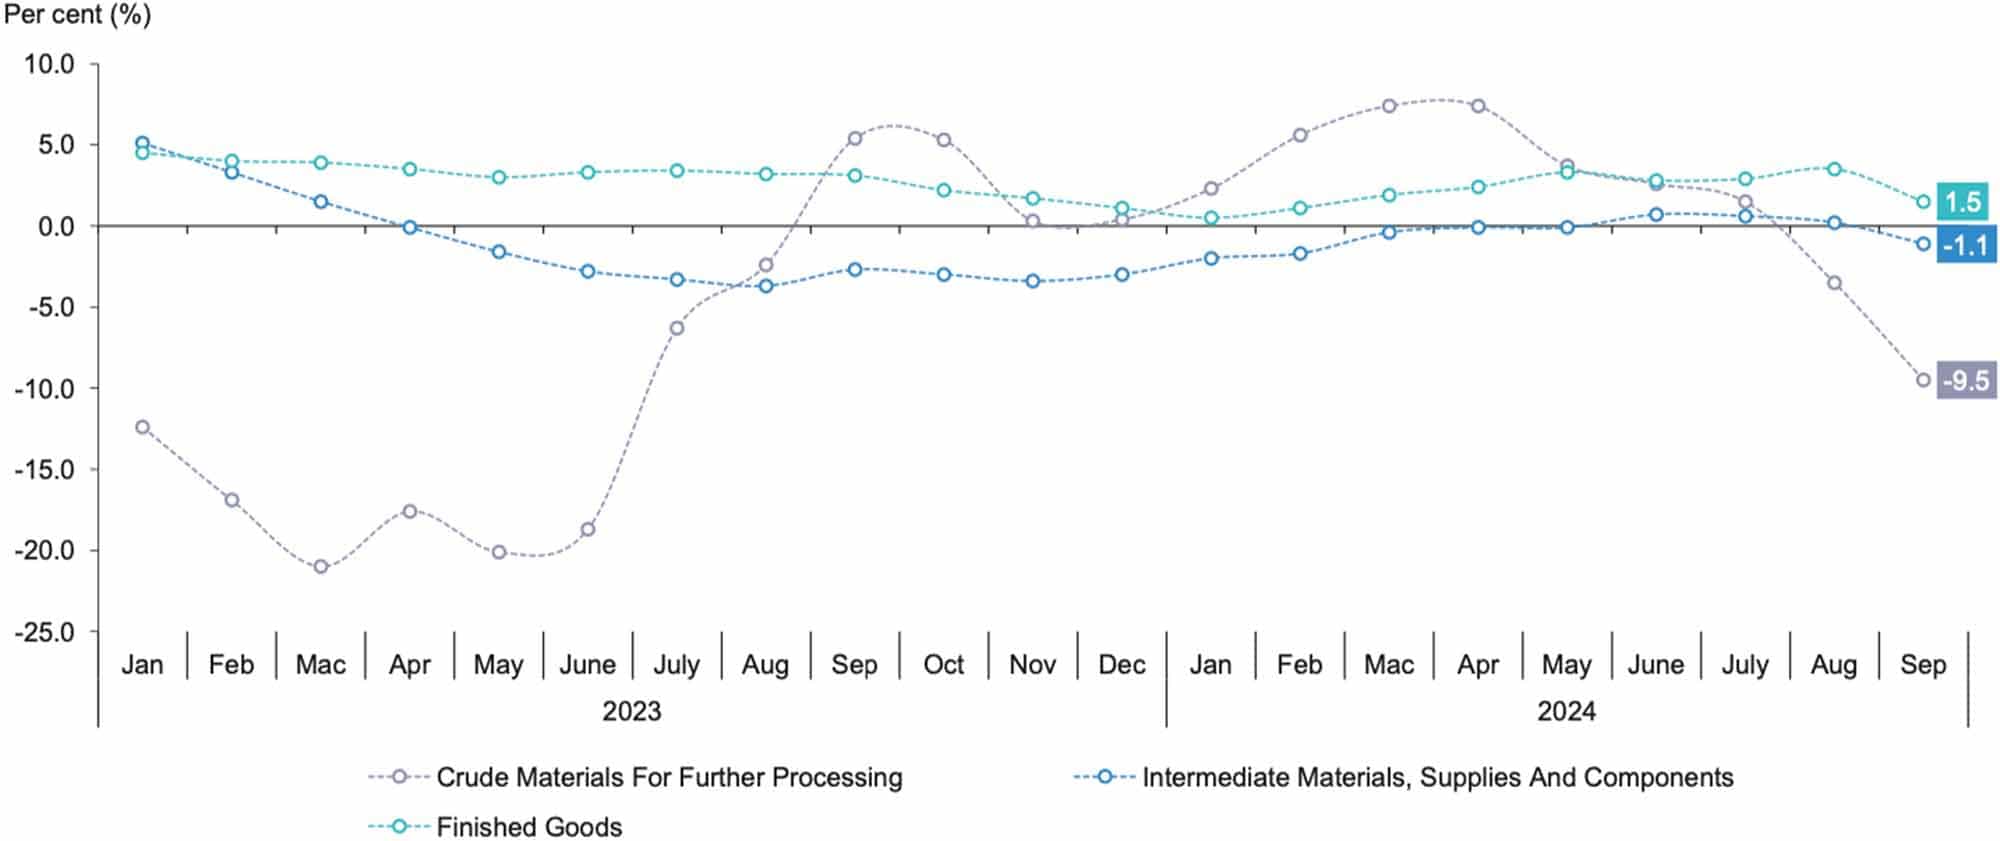
The Finished goods index went up 1.5 per cent in September 2024 (August 2024: 3.5%) contributed by the Capital equipment (3.5%) index. Meanwhile, the Crude materials for further processing index decreased by 9.5 per cent (August 2024: -3.5%),primarily, due to a significant decrease in the Non-food materials index (-11.3%). Similarly, the Intermediate materials, supplies & components index went down by 1.1 per cent (August 2024: 0.2%) due to decline in the Processed fuel & lubricants (-11.0%).
Looking at selected countries, the United States producer price index rose by 1.8 per cent in this month,slightly slower than the 1.9 per cent increase recorded in August 2024. Japan’s producer price index continued to rise 2.8 per cent, compared to an increase of 2.6 per cent in the previous month, contributed by the higher costs of transport equipment and beverages & foods. Factory prices for United Kingdom-made goods fell by 0.7 per cent, from a 0.3 per cent increase in the previous month, due to the chemicals and paper & printed materials. Meanwhile, China’s producer prices dropped by 2.8 per cent in September 2024, a steeper decline than the 1.8 per cent recorded in August 2024, mainly attributed by decreases in the mining and raw materials sectors.
Global oil prices reached their lowest level since December 2021, settling at USD74 per barrel. This decline is backed by a downward revision of the demand forecast by the Organisation of the Petroleum Exporting Countries (OPEC+) for both 2024 and 2025, reflecting a weakening outlook for global demand and the expectation of an oil surplus. Additionally, the U.S. Energy Information Administration (EIA) forecasts further pressured oil prices, as concerns about China’s demand continued to weigh on the market.
Concurrently, the Malaysian Palm Oil Board (MPOB) has projected that the price of crude palm oil will remain around RM4,000 per tonne by the end of the year. However, there is potential for prices to rise further, following a decrease in production that could reduce stock levels within the country and positively influencing prices.
The world economy is gradually recovering, but challenges remain. According to the World Economic Outlook report in October 2024 by International Monetary Fund’s (IMF), global growth is expected to stay steady at 3.2 per cent for both 2024 and 2025. However, this is slightly below pre-pandemic levels. Advanced economies are predicted to grow by 1.8 per cent during the same period, supported by stronger domestic demand and lower inflation. Emerging markets are growing faster, with economies in Asia like India (7.0 per cent) and China (4.8 per cent) leading the way. This growth is driven by advances in technology and infrastructure investments. However, geopolitical issues like oil-related conflicts and supply chain constraints, along with climate-related challenges, are slowing growth in some regions.
Malaysia’s economy has shown solid performance this year despite global uncertainties. In the third quarter of 2024, the economy grew at 5.3 per cent, from 5.9 per cent growth in in the previous quarter. The growth was supported by strong performances in Services, Manufacturing, and Construction. On the demand side, private spending and investments were the key drivers.
Malaysia’s economy grew across key sectors, with Services sector increased 5.2 per cent in Q3 2024, led by retail and wholesale trade, as well as transportation and storage services. This reflects higher consumer spending and demand for logistics services. Following the same momentum, the Manufacturing sector expanded by 5.6 per cent, with strong growth in electrical and electronics production. Food and beverage manufacturing also contributed to this positive performance. Also, the Construction sector recorded impressive growth of 19.9 per cent, driven by large infrastructure projects and housing developments. Besides, the Agriculture sector grew at 3.9 per cent, slower than in the previous quarter, due to reduced production in the oil palm sub-sector. Meanwhile, the Mining sector declined by 3.9 per cent, mainly due to lower crude oil and natural gas output.
Looking at the external factor, Malaysia’s trade remained resilient in Q3 2024. Total trade grew at 13.7 per cent, reaching RM743.2 billion. Exports increased by 7.8 per cent, supported by higher demand for manufactured goods. Imports grew even faster than Exports with the growth of 20.8 per cent, reflecting by strong domestic demand for machinery and other inputs. Foreign Direct Investment (FDI) also rose significantly, with RM14.5 billion recorded in Q3 2024, up from RM9.2 billion in the same quarter last year. Key investors came from Singapore, Hong Kong, and Switzerland.
Malaysia’s inflation rate eased to 1.8 per cent in September 2024, reflecting price stability in goods and services. The labour market also improved, with the labour force participation rate reaching 70.5 per cent. Unemployment remained steady at 3.2 per cent, and more people joined the workforce.
Despite these positive trends, Malaysia faces challenges in the traditional sectors. Production of natural rubber and fresh fruit bunches has declined. The Producer Price Index (PPI), which measures the prices of producers receive for their goods, dropped by 2.1 per cent in September 2024, reflecting lower global commodity prices.
Malaysia has shown strong economic resilience in the first nine months of 2024, maintaining growth despite global uncertainties. The performance reflects effective policies, robust trade, and sectoral progress. Guided by the MADANI framework, which emphasises digitalisation, sustainability, and inclusivity, the country is building a solid foundation for future growth. Looking ahead, Malaysia’s prospects for 2025 appear promising, with Leading Index (LI) grew by 1.8 per cent year-on-year and the smoothed long-term trend remained above 100 points. However, success will depend on effectively addressing both global risks, such as geopolitical tensions and fluctuating oil prices, and domestic challenges. Through sustained collaboration between the government and private sector, Malaysia is well-positioned to achieve its economic goals and strengthen its role as a regional leader.


National Real Estate Award Firm of the Year 2021, 2022, 2023, 2024
National Real Estate Award Industrial Firm of the Year 2020, 2022, 2023
National Real Estate Award Technology Firm of the Year 2021
National Real Estate Award Real Estate Agent of the Year 2020
National Real Estate Award Specialised Project of the Year 2019
National Real Estate Award CEO
National Real Estate Award Commercial Agency
National Real Estate Award Million Dollar Roof Top
National Real Estate Award Top Realtor

Star Property Best Practice Award 2019

Star Property All-Star Agency 2017

iProperty Elite Project Marketing Agency

iProperty Agency of the Year (Platinum)

Asia Pacific Property Awards

Asia Pacific Residential Property Awards